Stack
About
A personal fitness app available on desktop and mobile, consolidating five data sources into one coherent view: Strava (GPS activities), Whoop (recovery, HRV, sleep), Intervals.icu (CTL/ATL/TSB fitness metrics), Withings (weight, body composition), and AtmoSud (air quality in Nice). The app runs as a PWA on a VPS, protected by Cloudflare Access, with n8n orchestrating all data refresh and a weekly AI-generated report delivered by email every Monday.
The story
This project started with a frustration. After years of competitive cycling and running, thousands of activities logged across Strava and Whoop, there was no connection between the two apps I open every day.
The two belong together. Physical activity affects sleep and recovery. Sleep and recovery affect performance. The other tools I opened daily could not talk to each other either: Intervals.icu for fitness load, Withings for body composition, AtmoSud for air quality in Nice.
The data existed everywhere. Effort, recovery, fitness load, body composition, air quality: all of it shapes performance and health. A single view of it existed nowhere.
Over the years, this data had accumulated in CSV files that I would analyse in progressively more complex Google Sheets. That was no longer enough.
Now I have an app that tells me exactly what I want to know. Where my day stands across the metrics that matter. What the current air quality is, and whether it is worth monitoring before a session. How my seasons compare year over year to prepare for competition. This app is simply the most important one on my phone since I built it.
On top of that, I receive a full weekly breakdown of my training programme, covering data points that are genuinely difficult to compare from one season to the next, from one month to the next, and doing so in the context of my personal and professional life. The output is remarkable.
Output
All data lands in CSV files on the VPS, never synced locally. Three n8n workflows run the system:
- WF1: refreshes all five sources six times a day, triggers each Python script via SSH, and checks exit codes with —strict mode on all five scripts. No source is blocking: if one fails, an alert fires but the remaining sources continue to update. WF1 can also be triggered manually from the app, and fires automatically after each Strava activity via webhook.
- WF2: runs every Monday at 8am, checks that the data is fresh before generating (verified via generated_at and report_filename), and sends an HTML report written by Claude Sonnet via the Anthropic SDK.
- WF3: fires on any WF1 or WF2 failure and notifies in parallel via Gmail and ntfy.sh.
The alerting workflow was the first thing I built, before the app itself.
Three of the five sources (Whoop v2, Withings v3, Strava) use OAuth2 with refresh token rotation. That is non-trivial work: the full token exchange flow is implemented in Python, with automatic renewal on each sync. n8n also handles the Strava webhook handshake and subscription automatically.
The React PWA is organised into tabs:
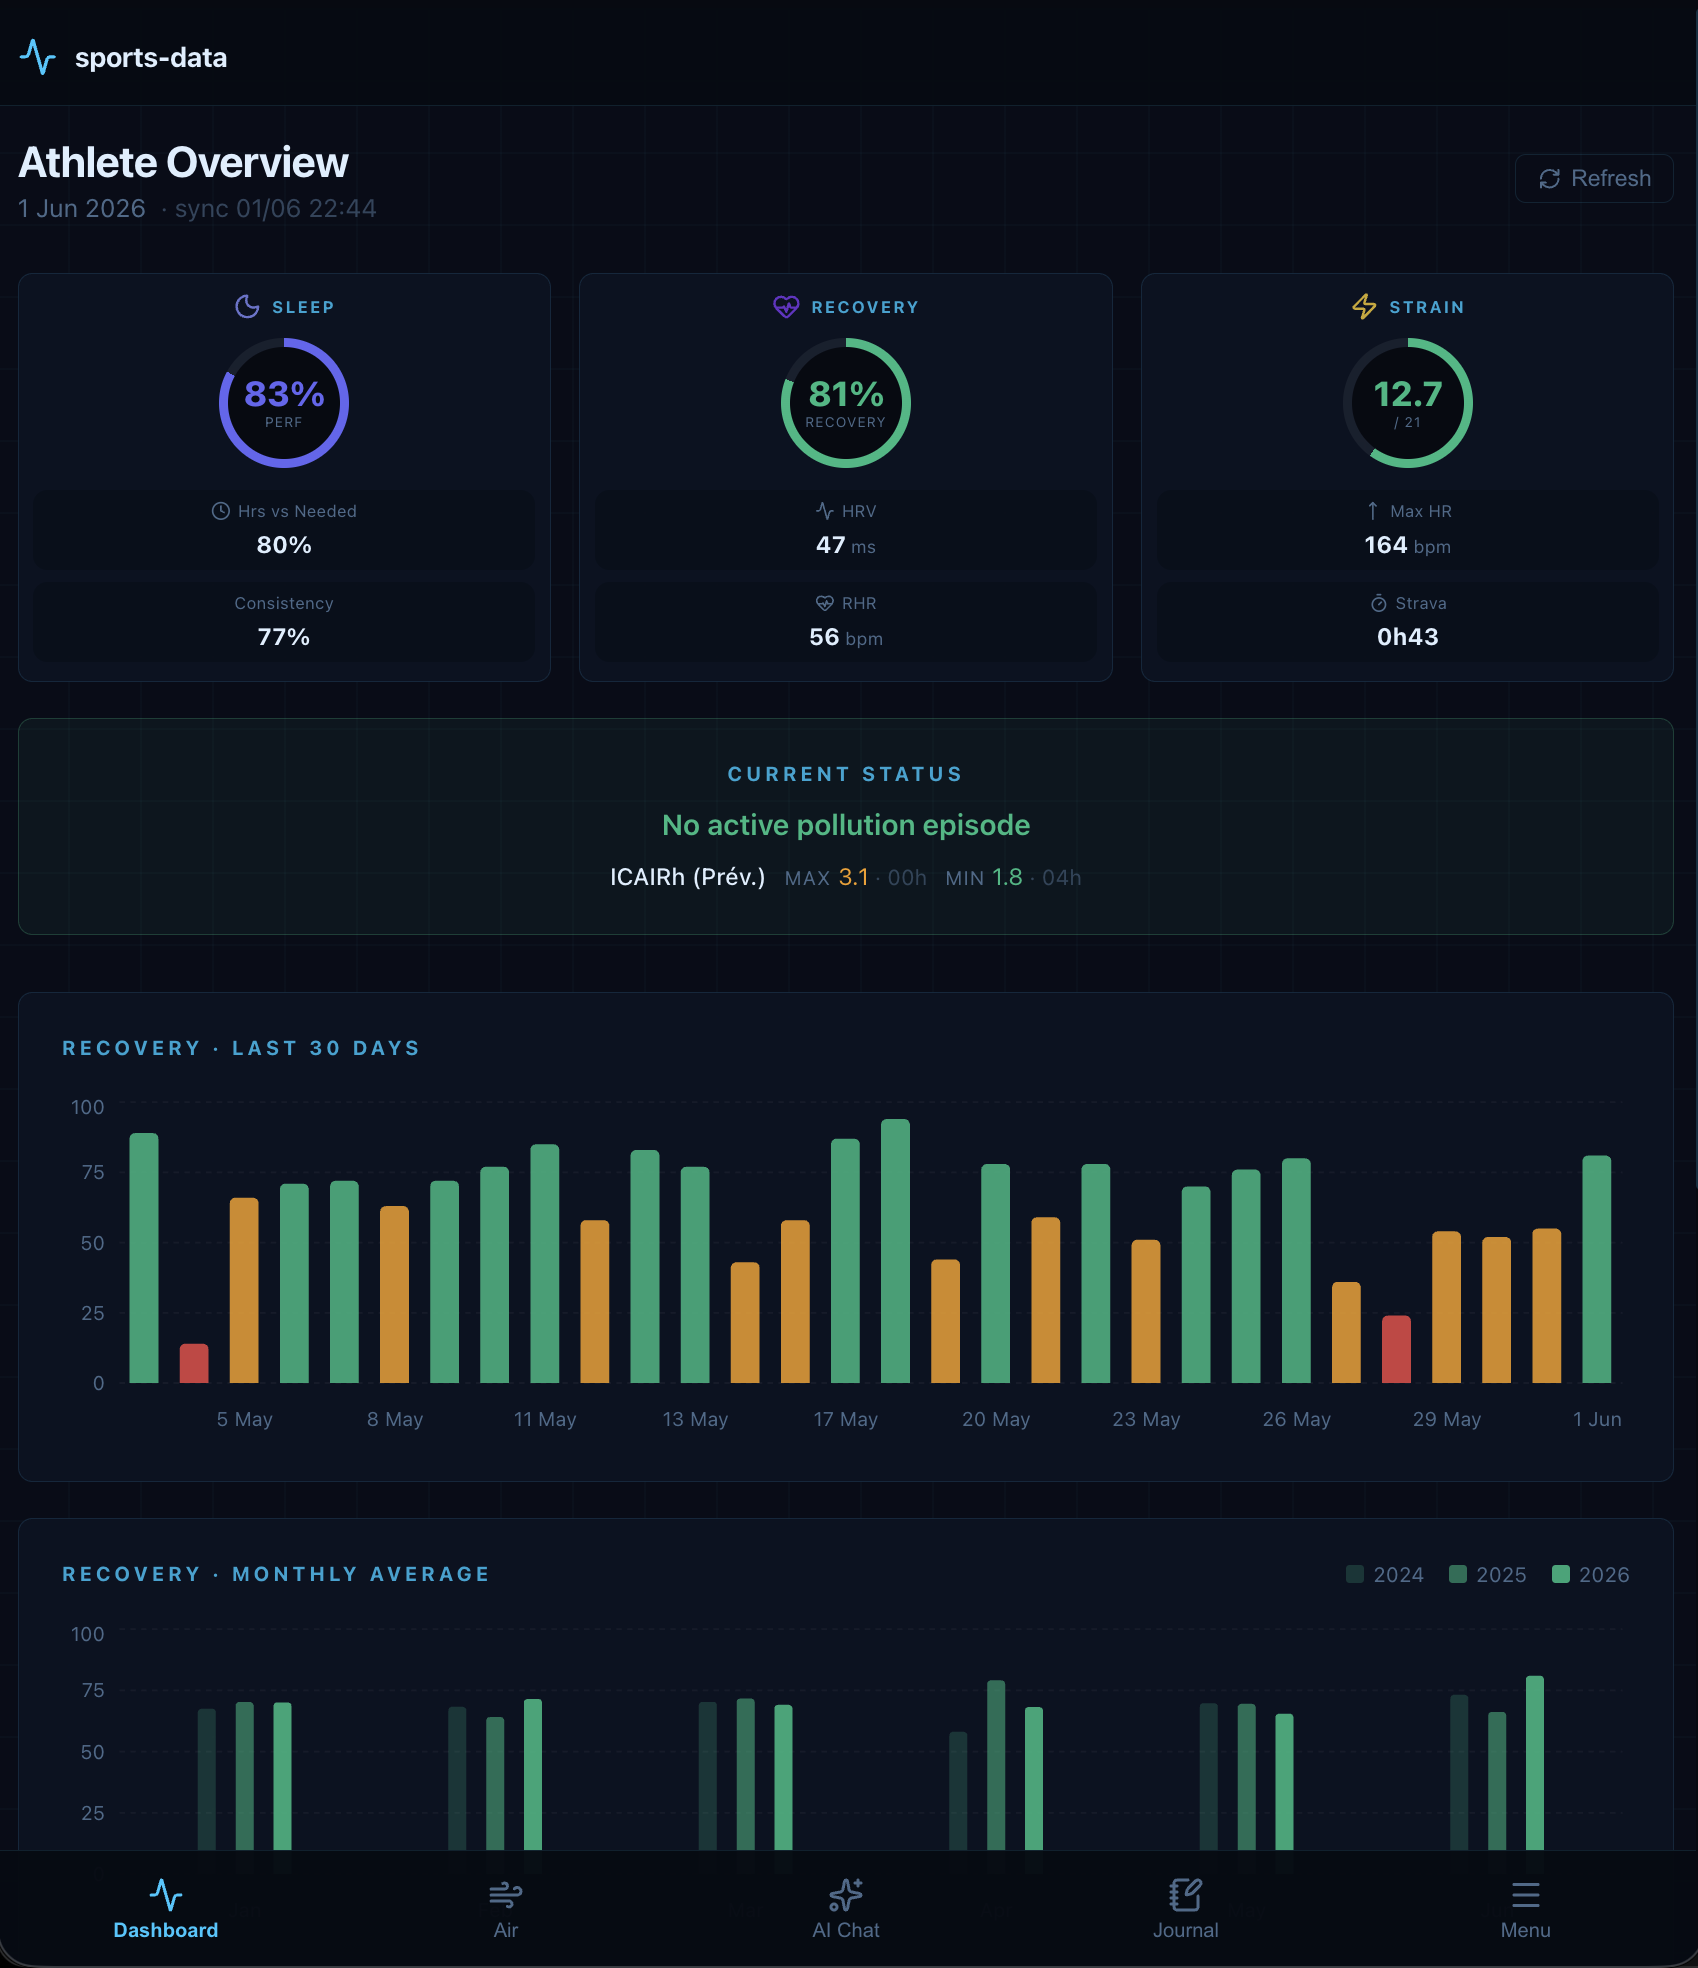
- Dashboard: sleep, recovery, and strain from the latest Whoop cycle, a compact air quality status bar, a 30-day daily recovery chart, and a monthly average comparison across three seasons.
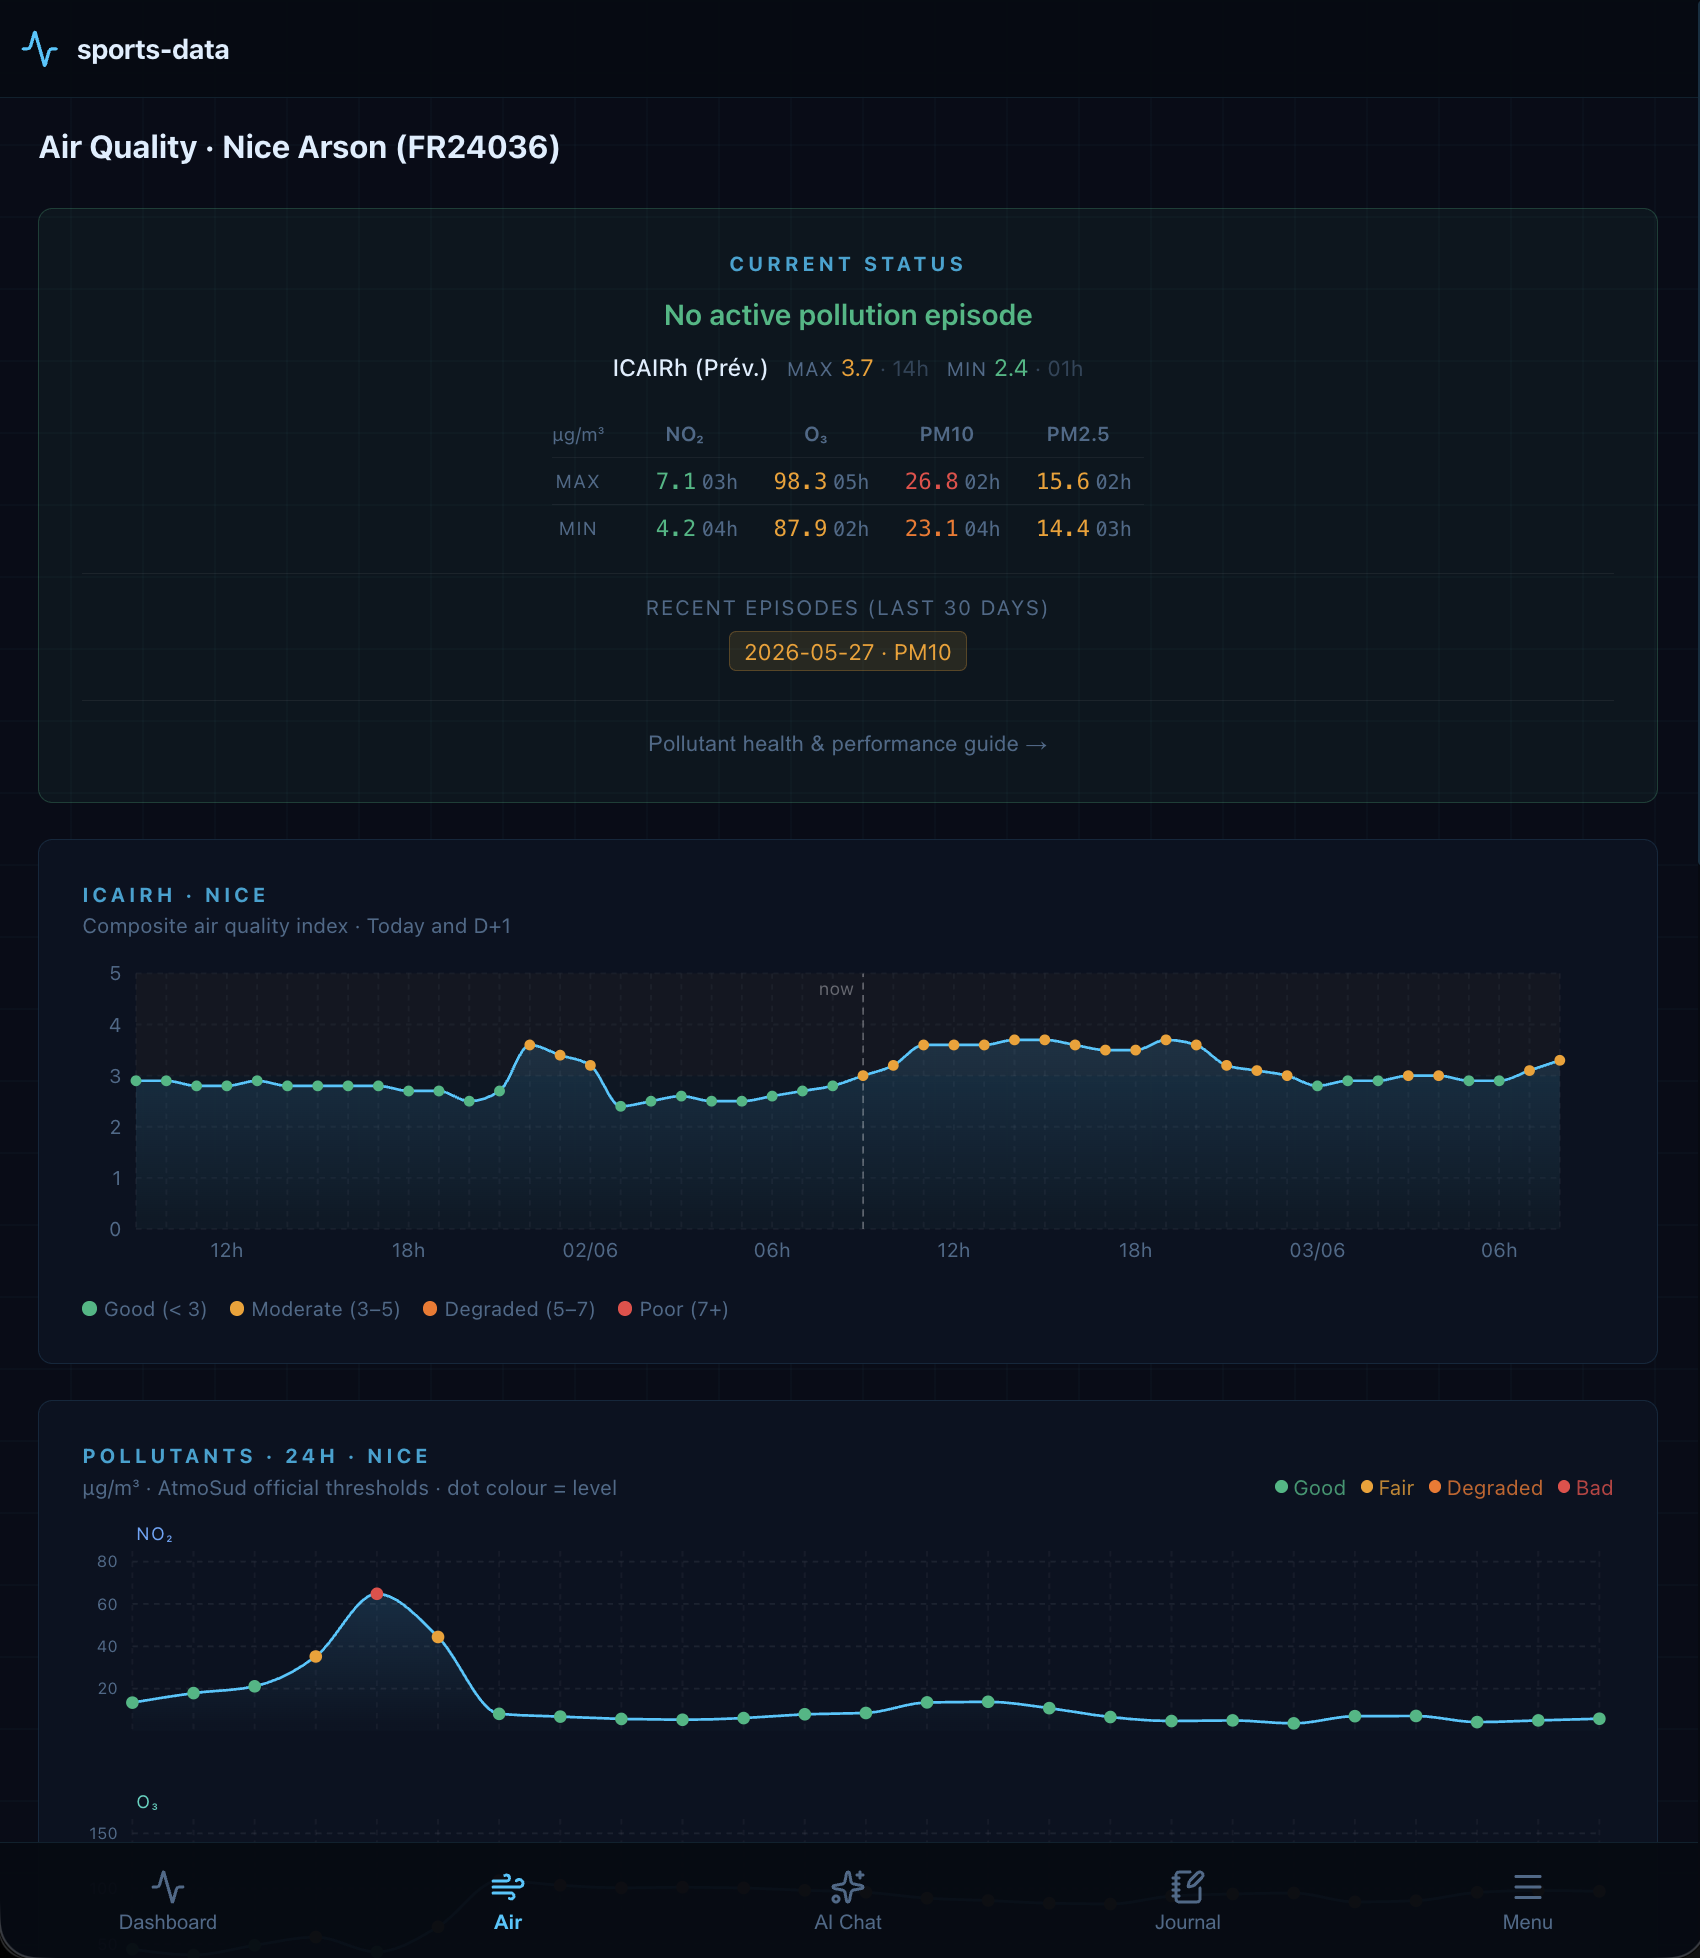
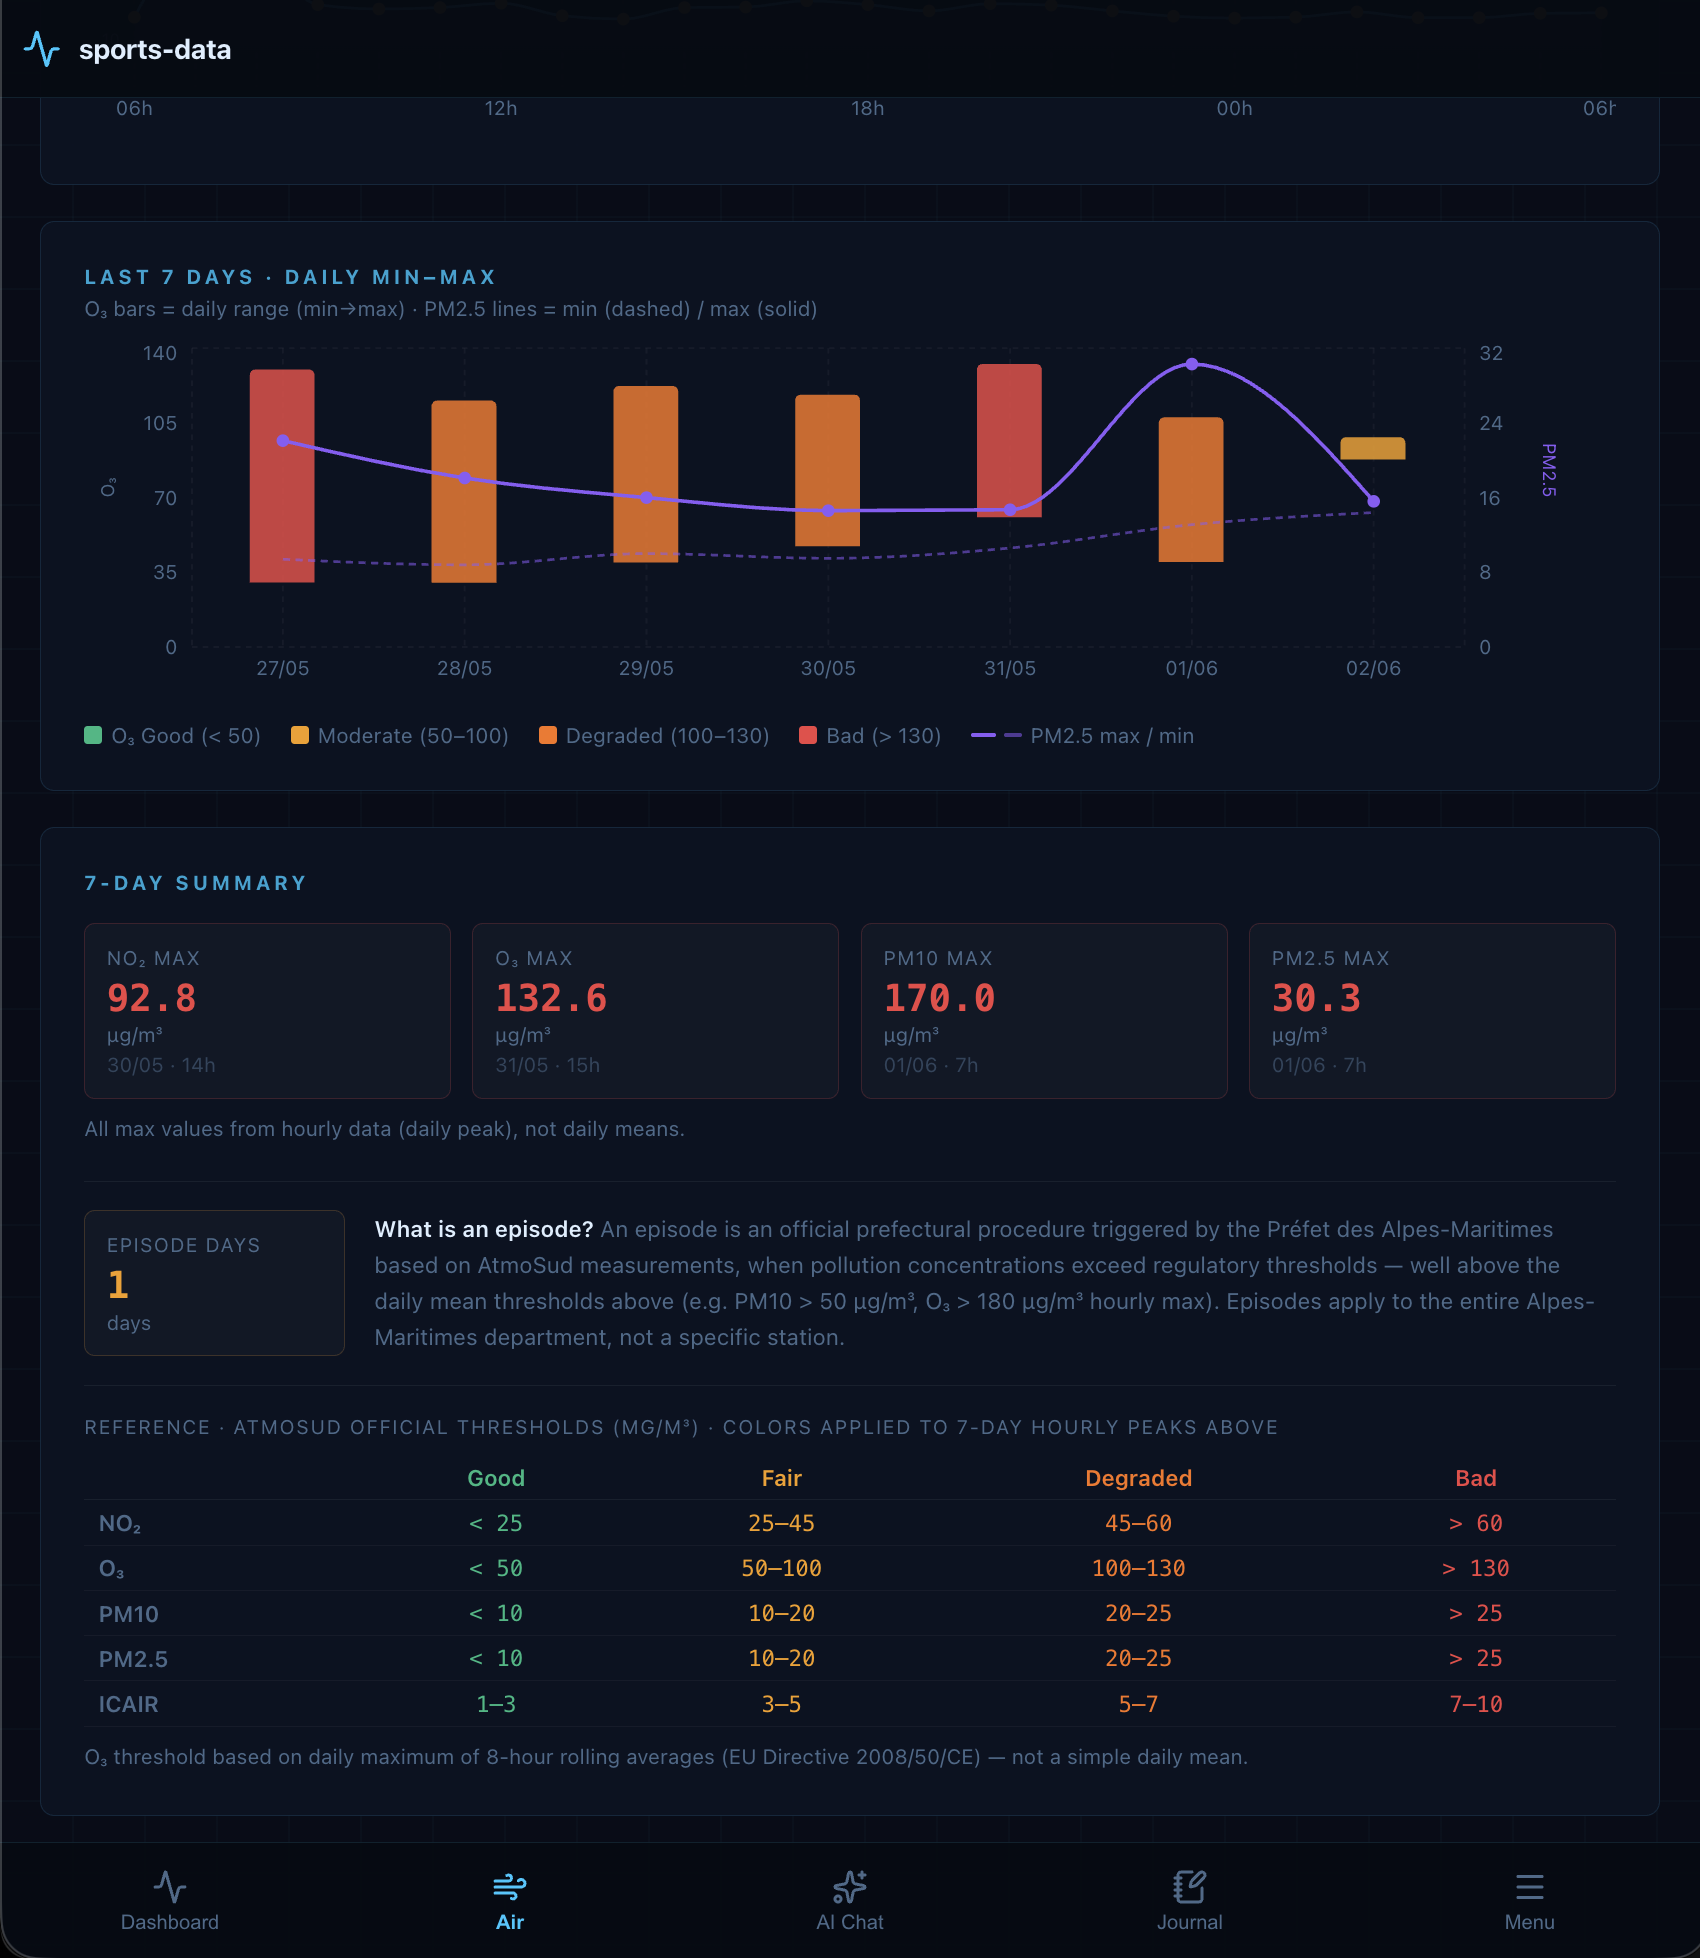
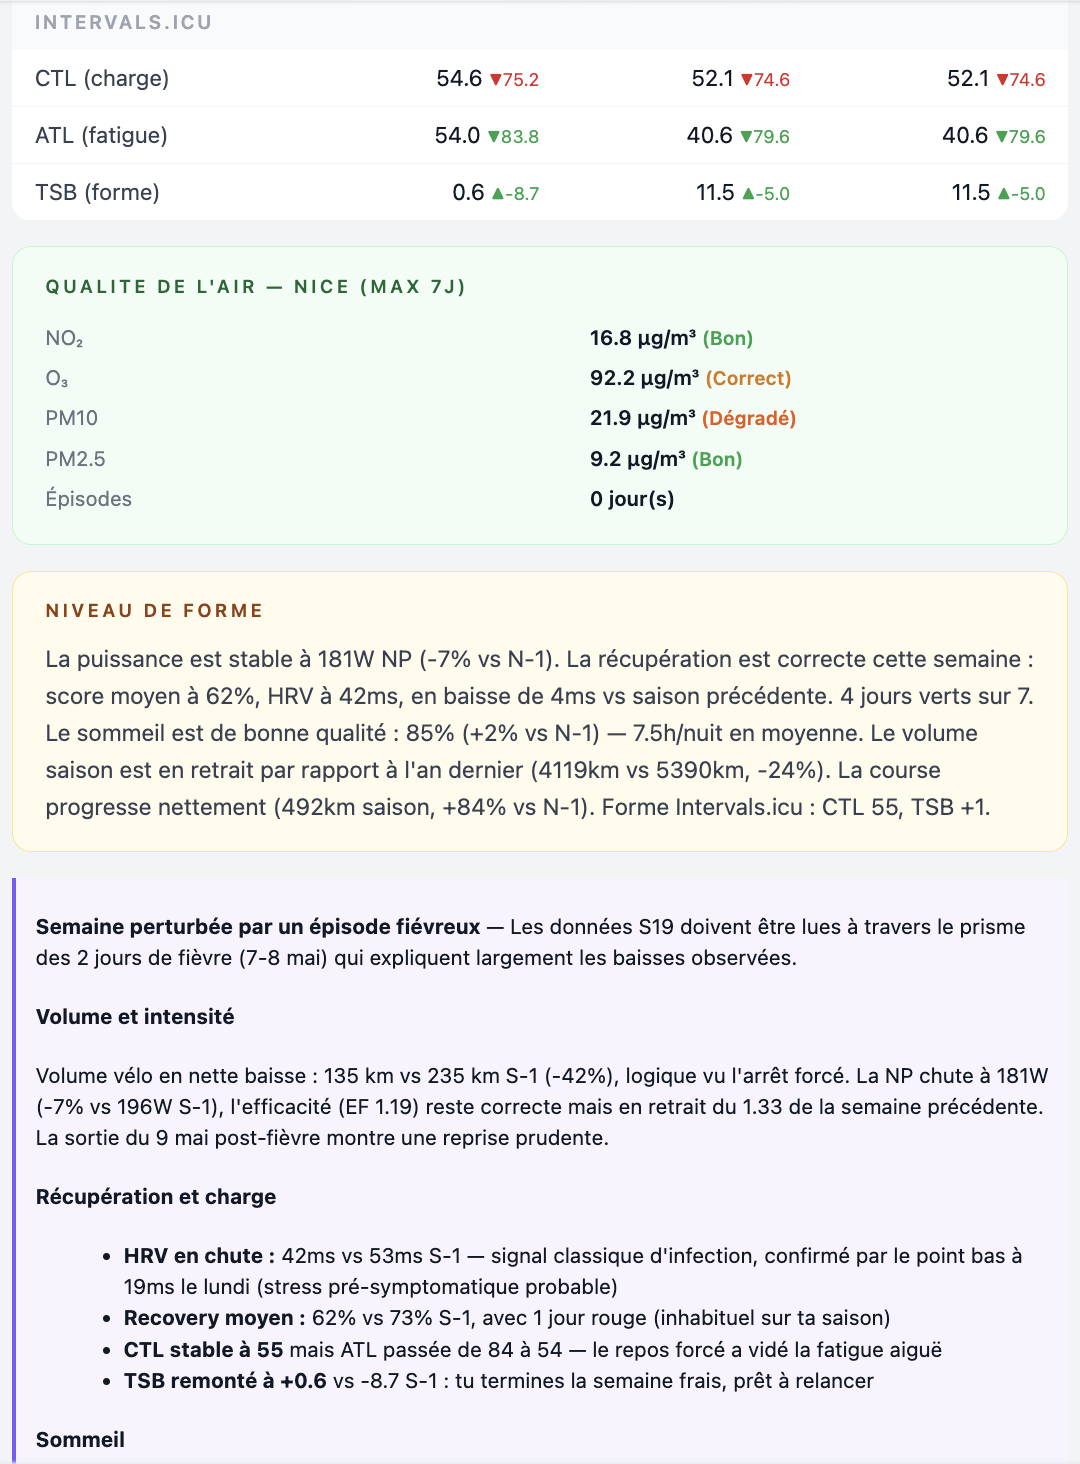
- Air: full air quality detail for the Nice Arson station. Current pollutant concentrations (NO2, O3, PM10, PM2.5) colour-coded by severity, an hourly composite ICAIRh index chart, per-pollutant 24-hour concentration curves, a 7-day daily range view with episode count, and the official AtmoSud threshold reference table. The tab links directly to a pollutant health and performance guide.
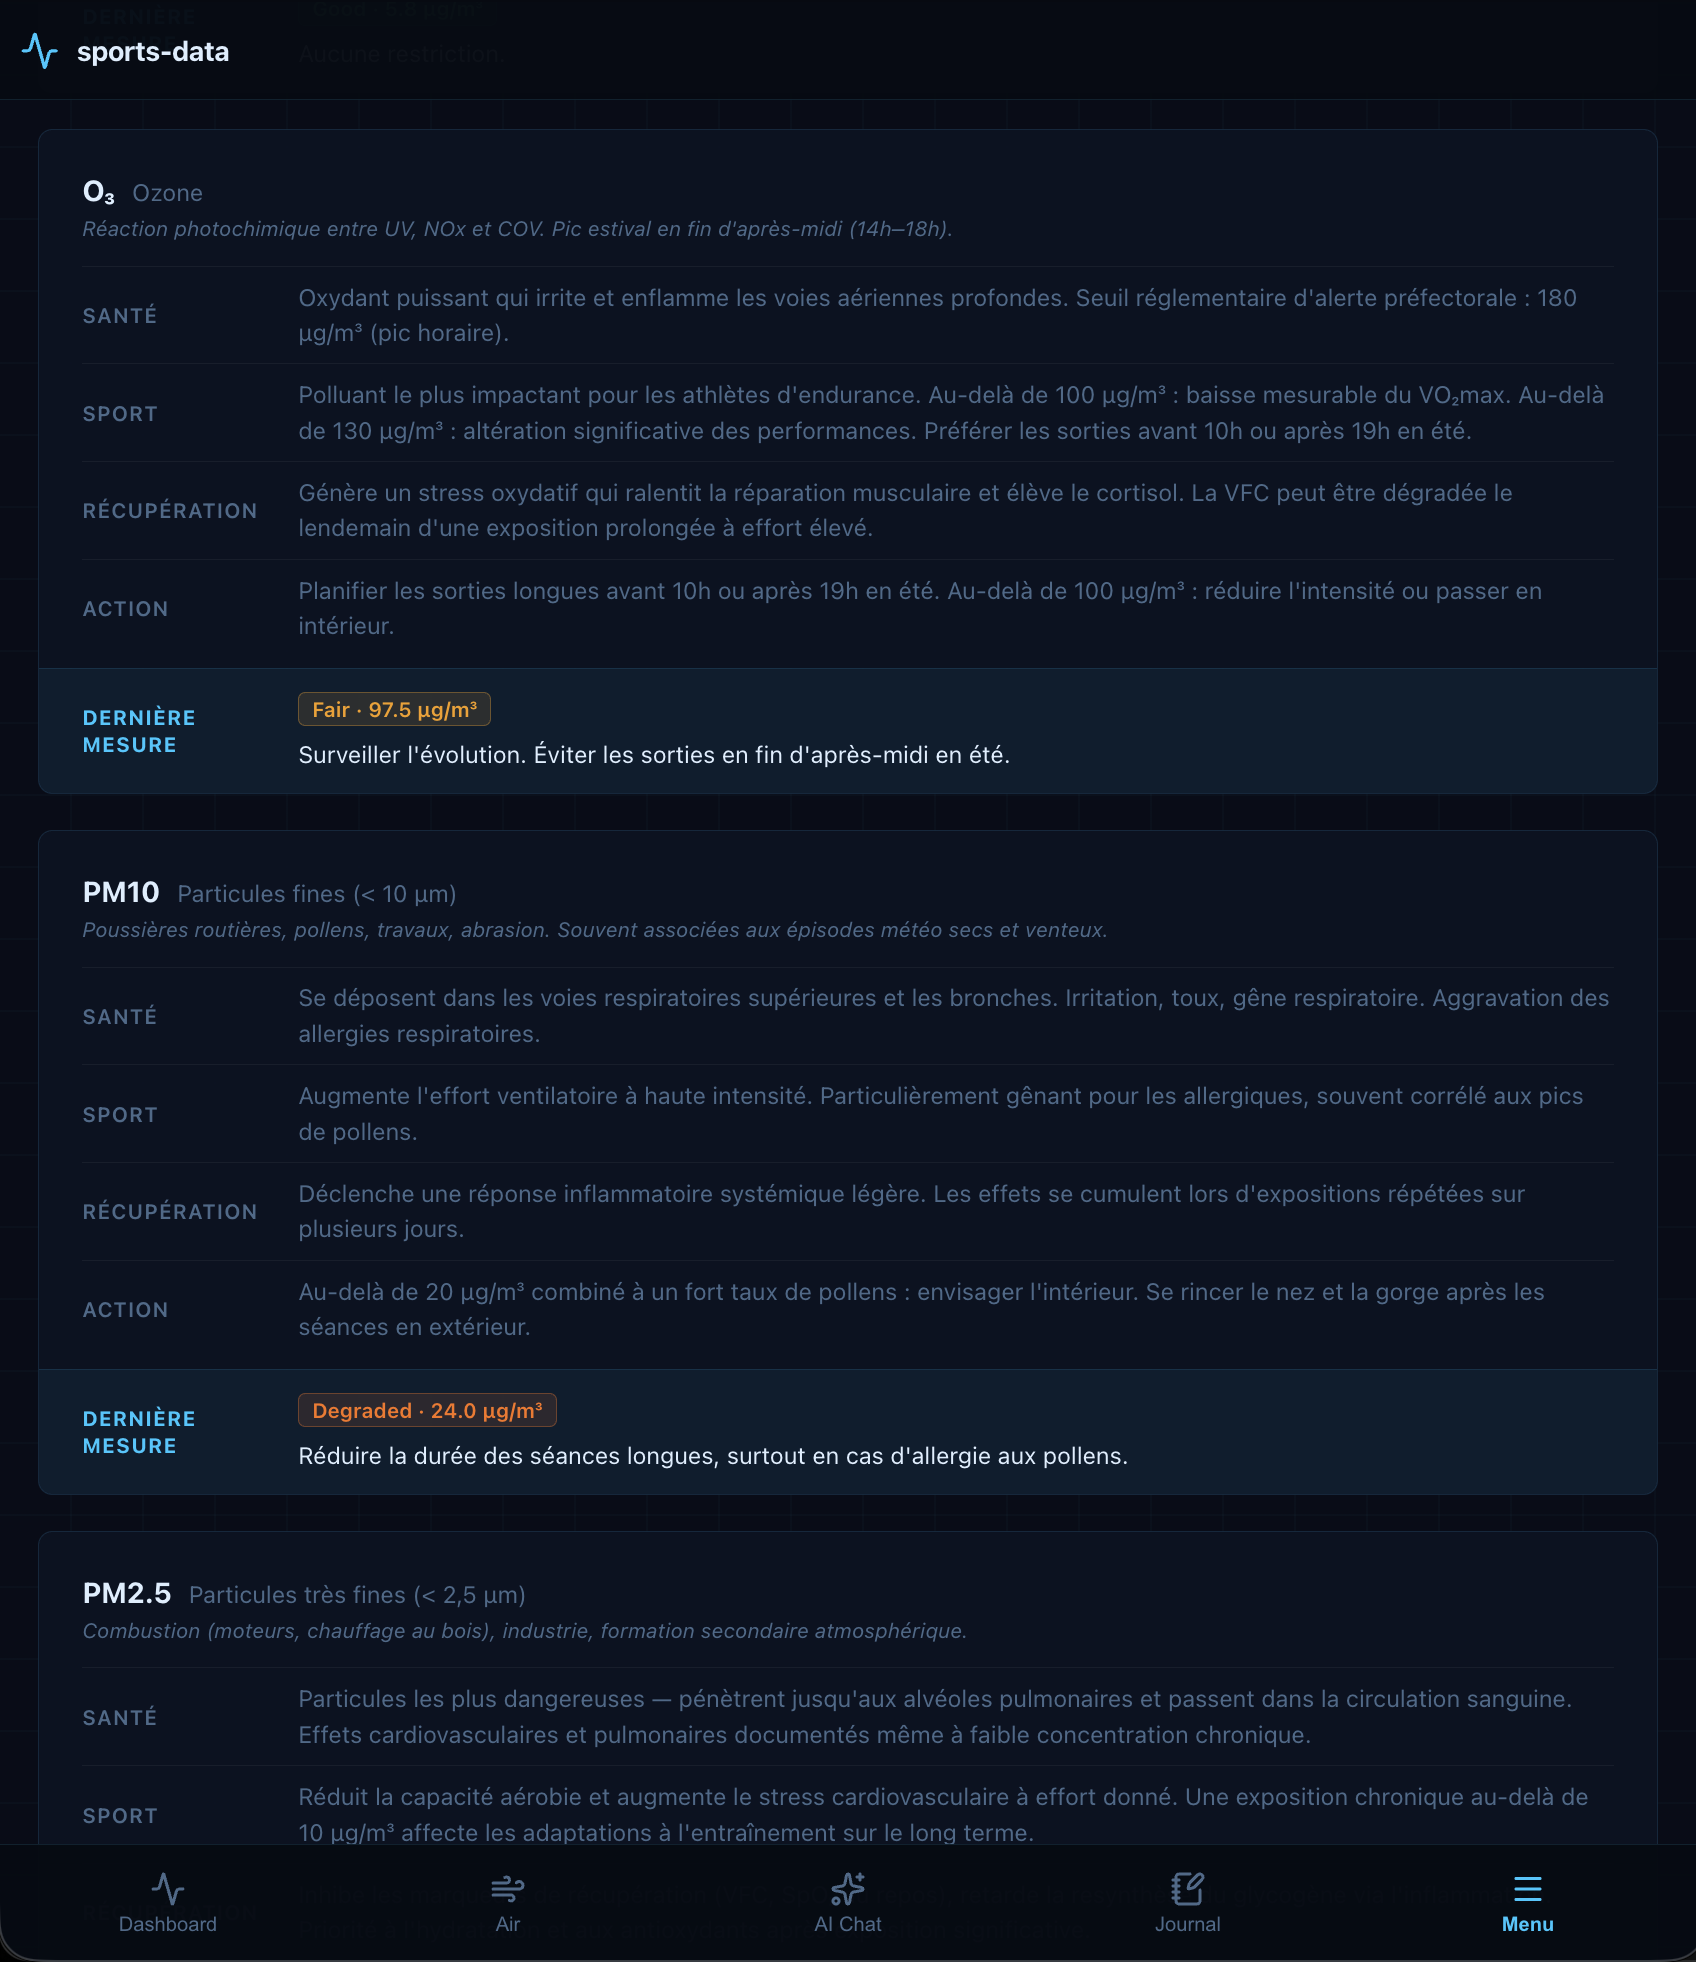
Pollutants (in French): accessible from the Air tab via a direct link. Each pollutant (NO2, O3, PM10, PM2.5) has its own card covering four dimensions: health impact, effect on sport performance, recovery implications, and a concrete action threshold. The current reading sits at the bottom of each card, colour-coded against the official severity levels. The aim is to convert a raw µg/m³ value into a decision: whether to train outside, reduce intensity, or adjust recovery expectations.
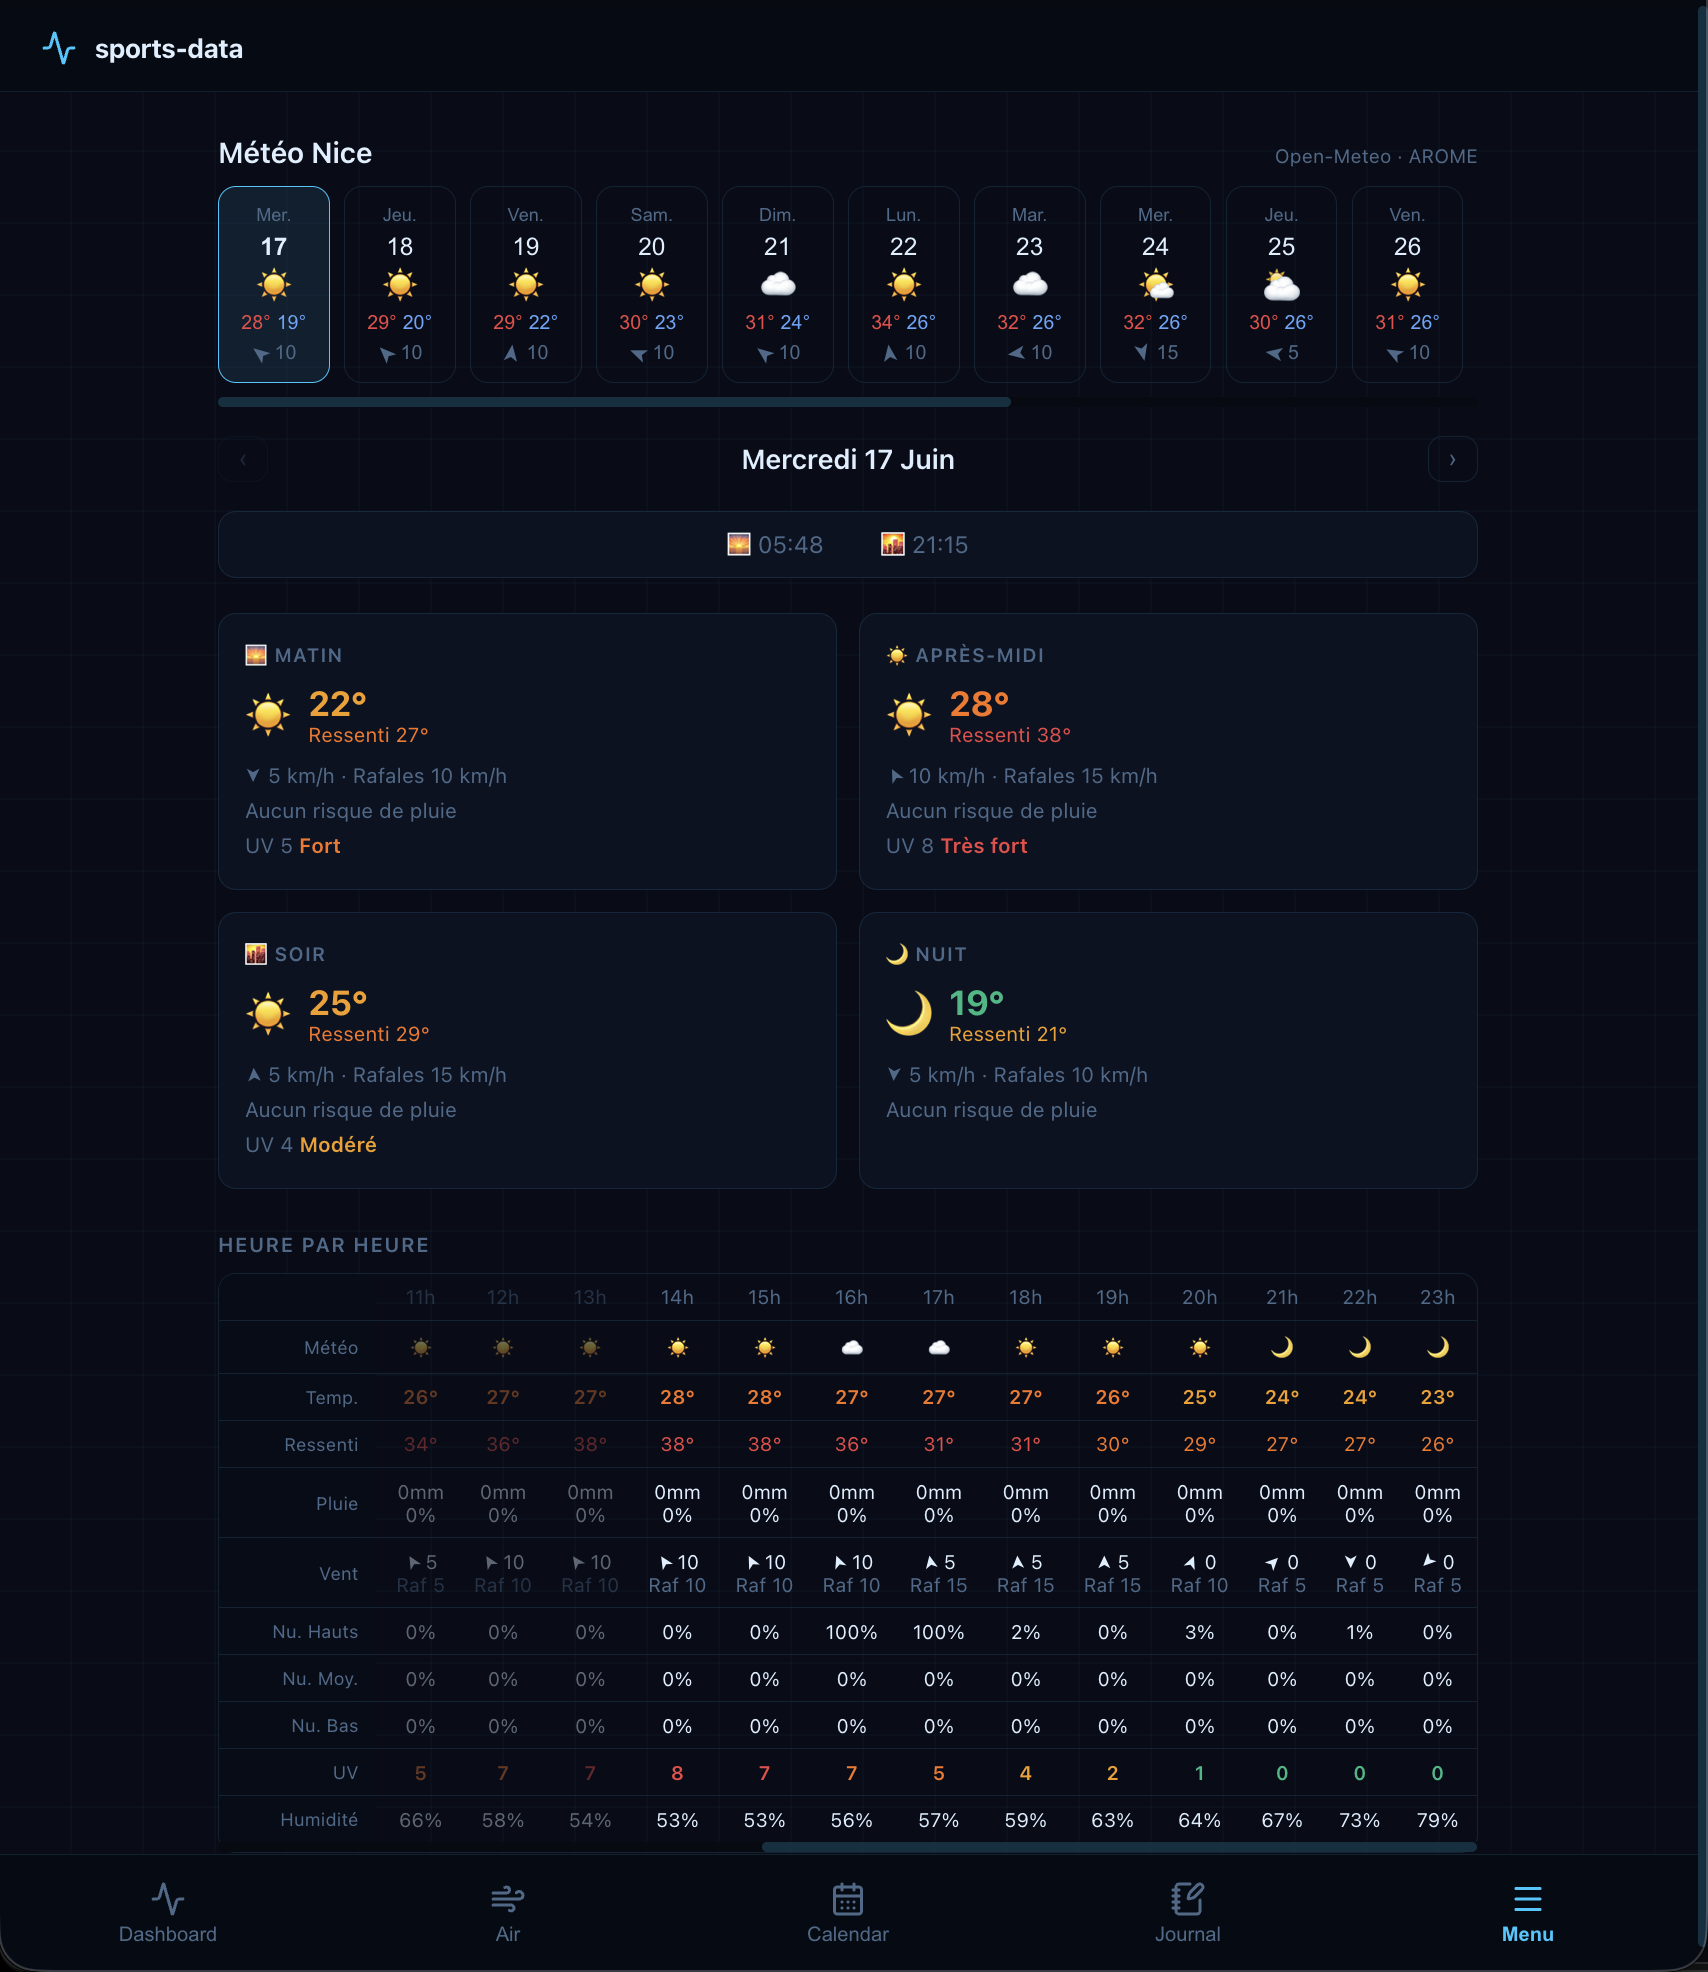
- Weather (in French): current conditions and short-range forecast for Nice — temperature, feels-like, wind speed and direction, precipitation, humidity, and UV index. A 24-hour hourly view and a 7-day daily outlook, used to plan session timing and decide between outdoor and indoor training.
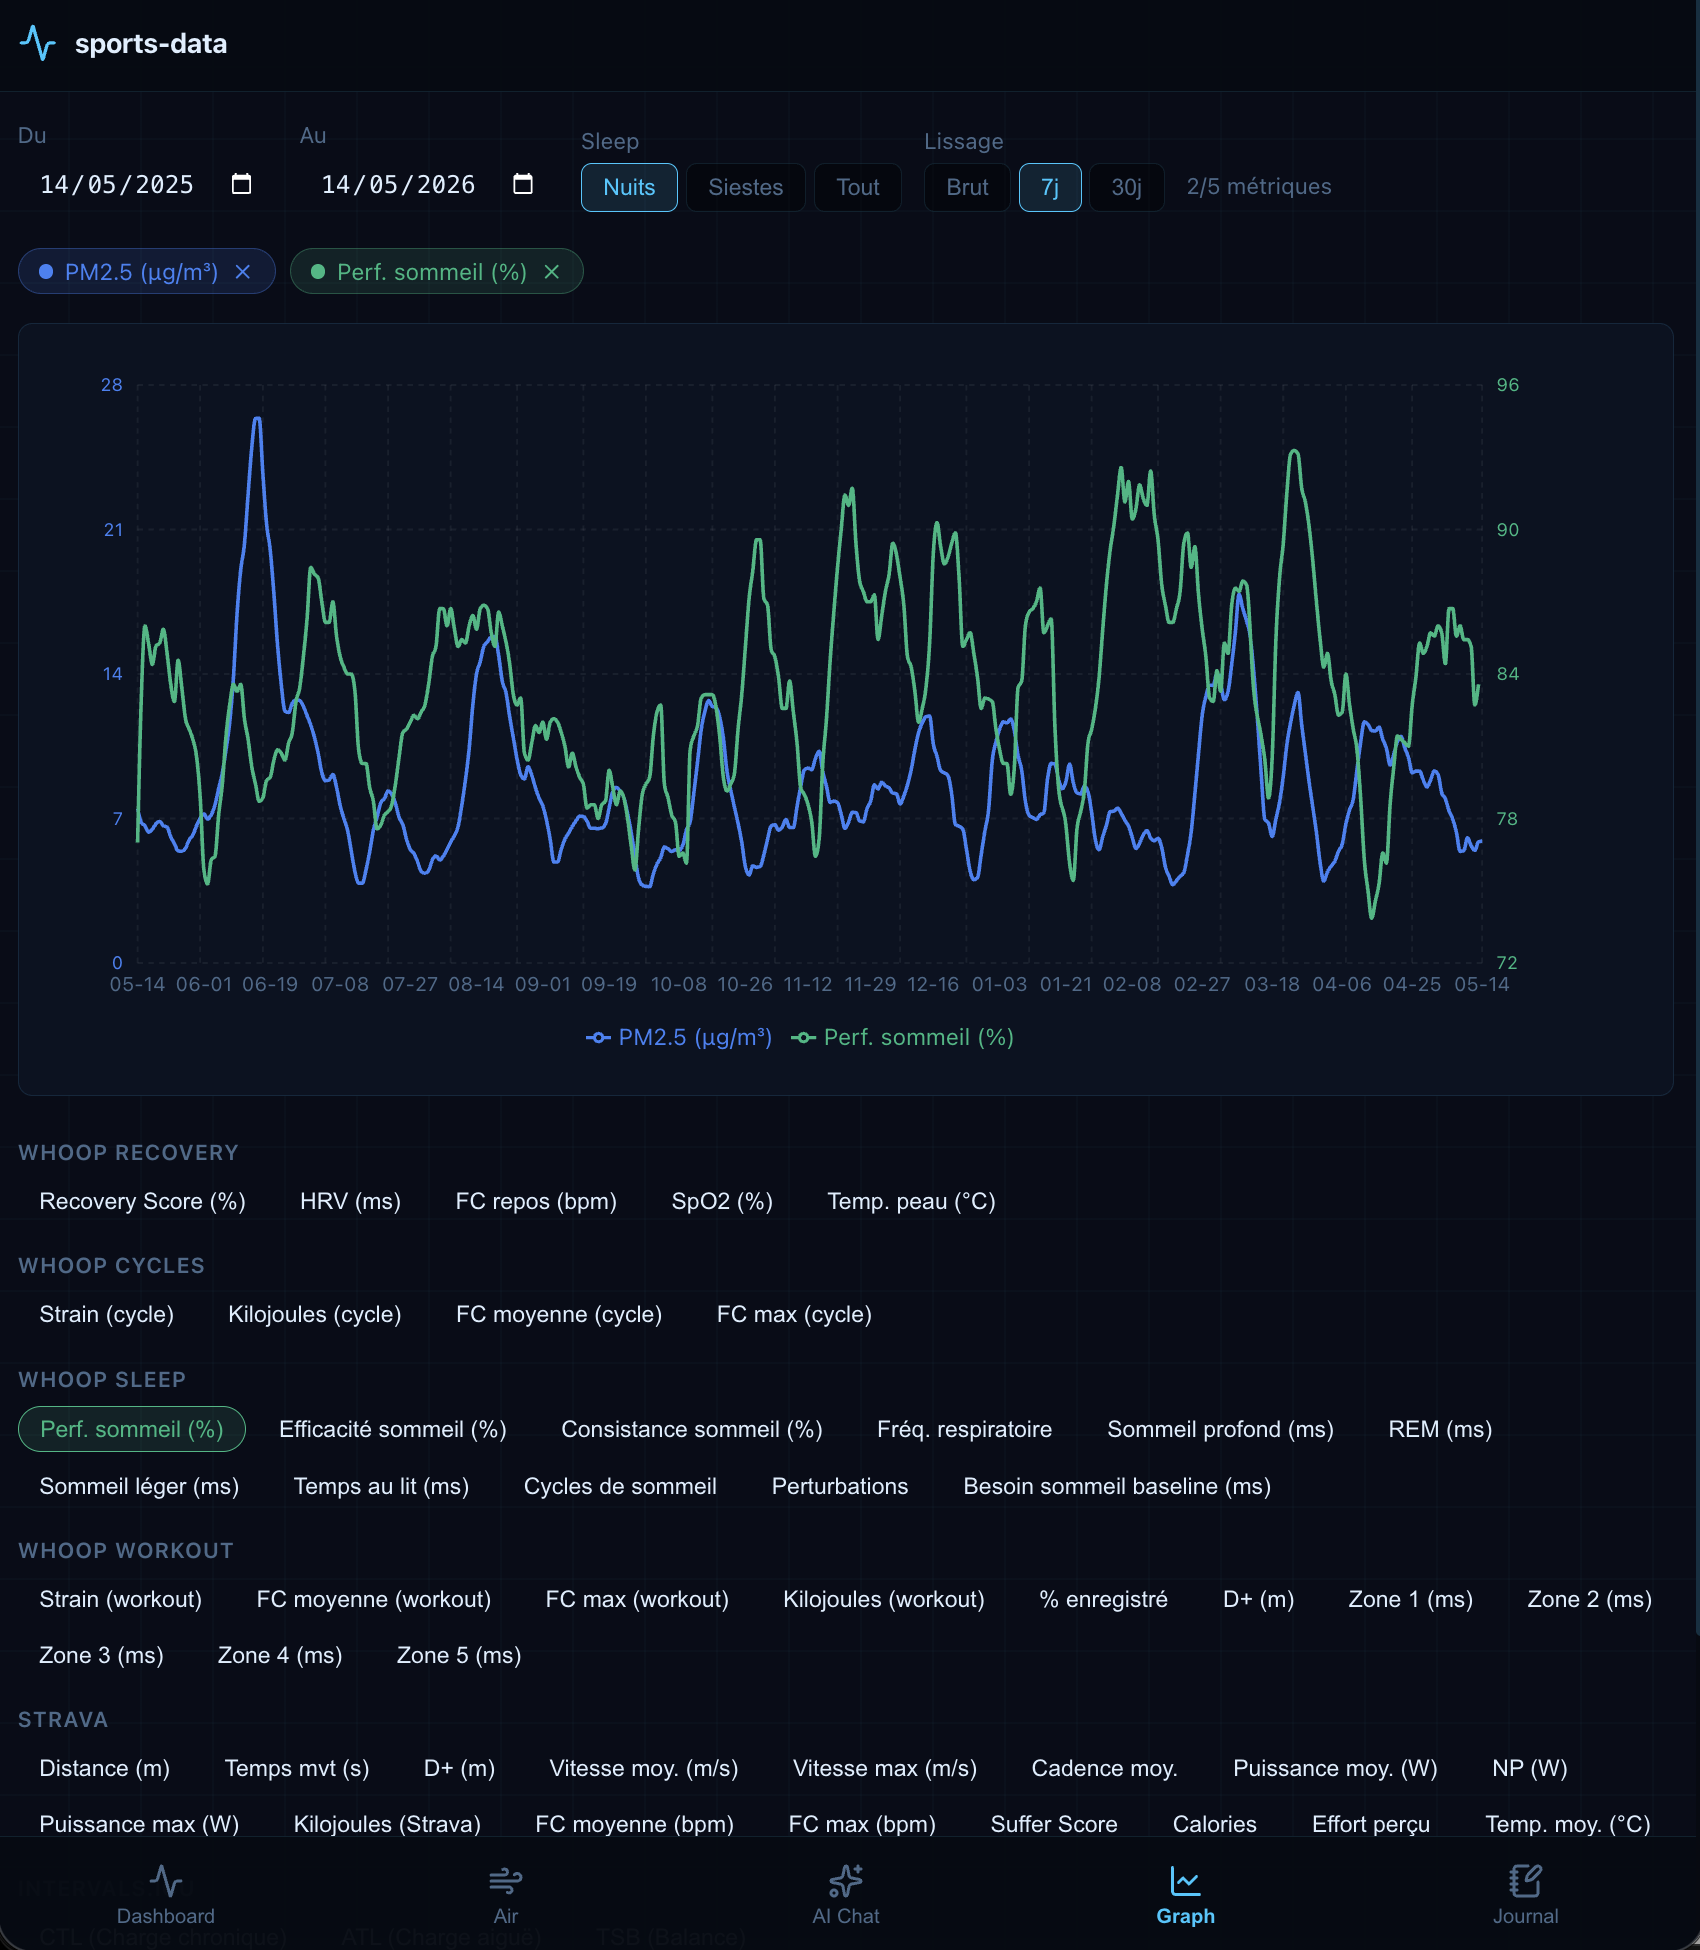
- Graph (in French): custom multi-metric visualisation. Up to 5 metrics selected across all sources, plotted on independent Y-axes with 7 and 30-day smoothing and date range filters.
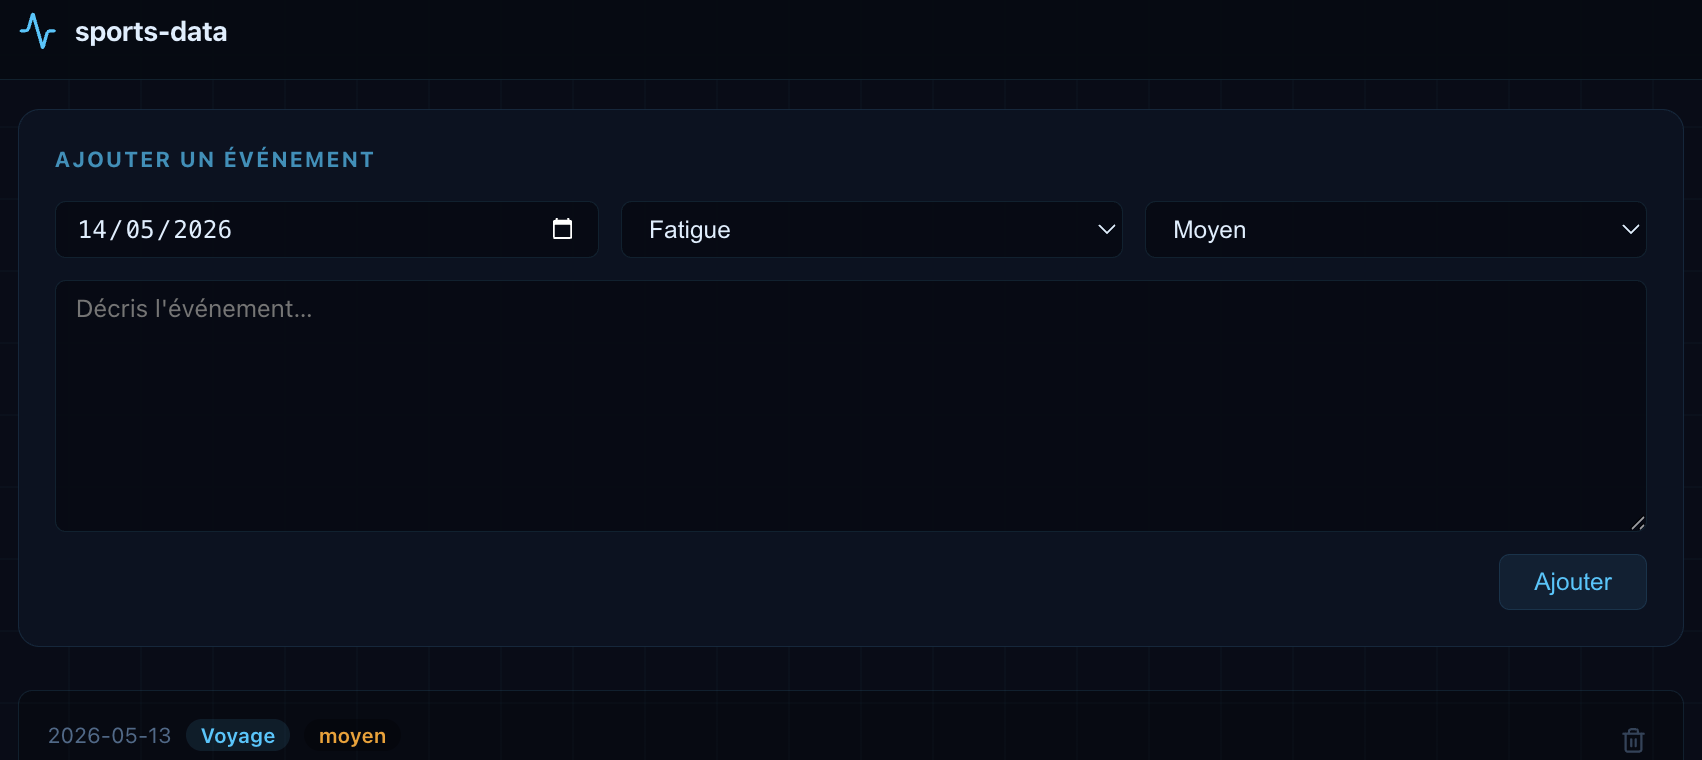
- Journal (in French): dated notes with type (illness, stress, travel, competition, etc.) and impact level. Each note feeds into both the weekly AI report and the AI Chat context.
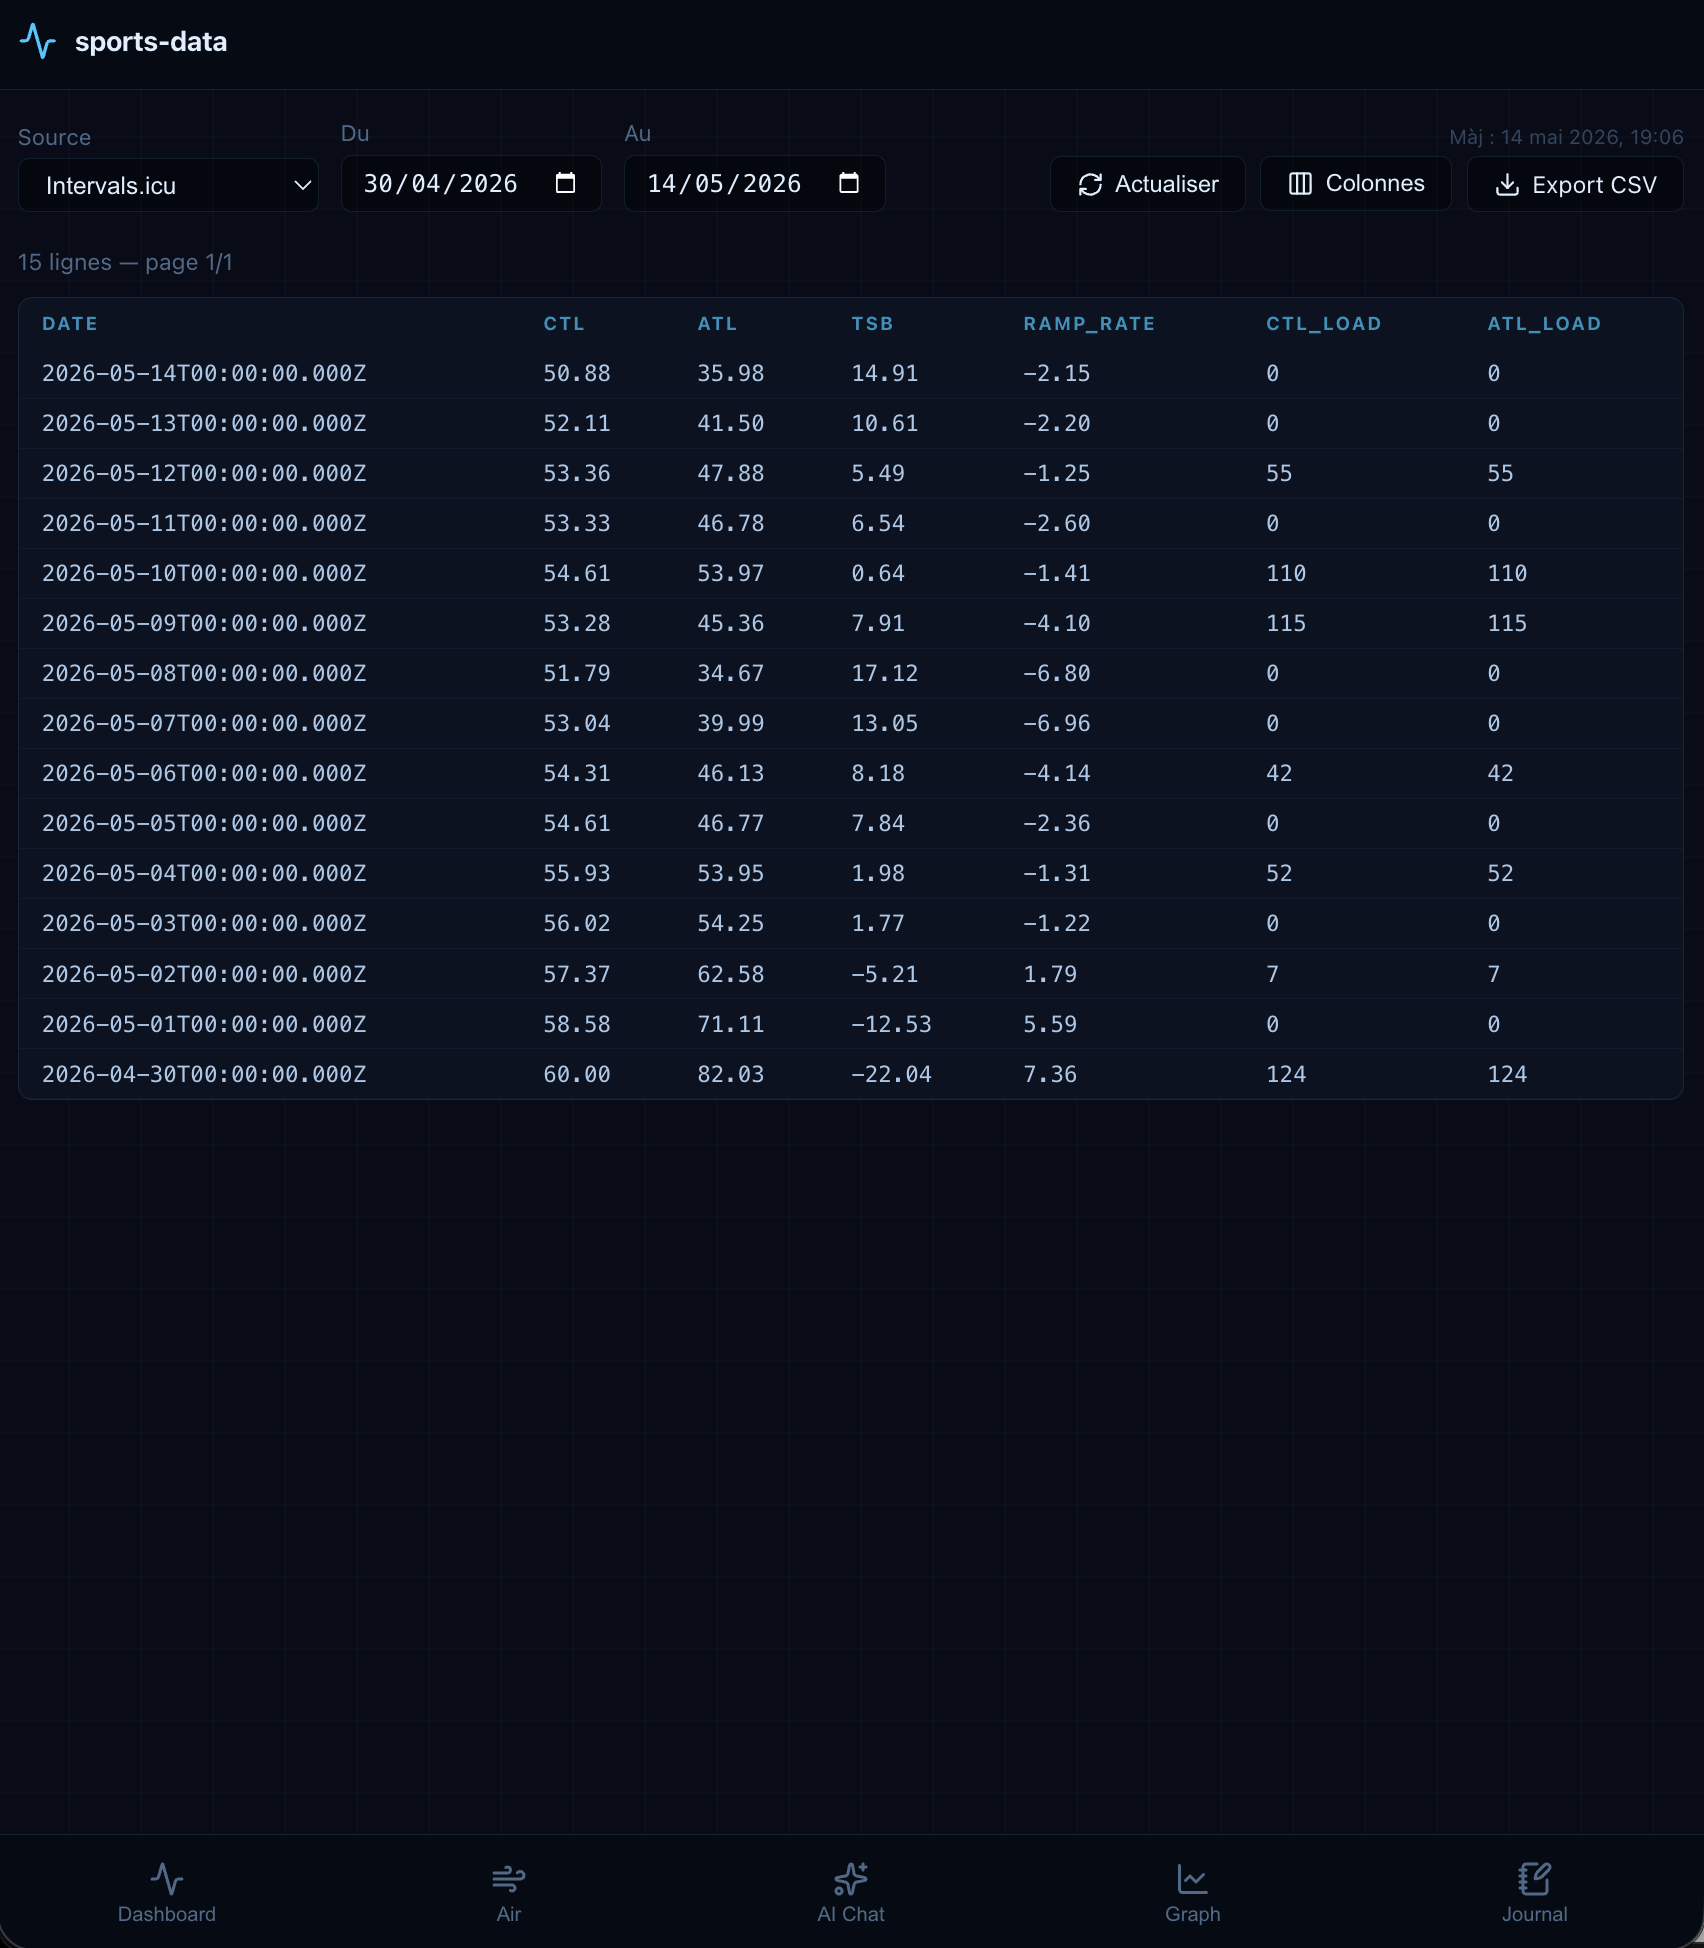
- Data: paginated raw data browser across all sources, with column picker, date range filter, CSV export, and a manual sync trigger.
- Coaching (full writeup in Sports Coach): three tabs added to the app as a dedicated coaching layer, replacing a human coach with an AI system built on two years of documented training history.
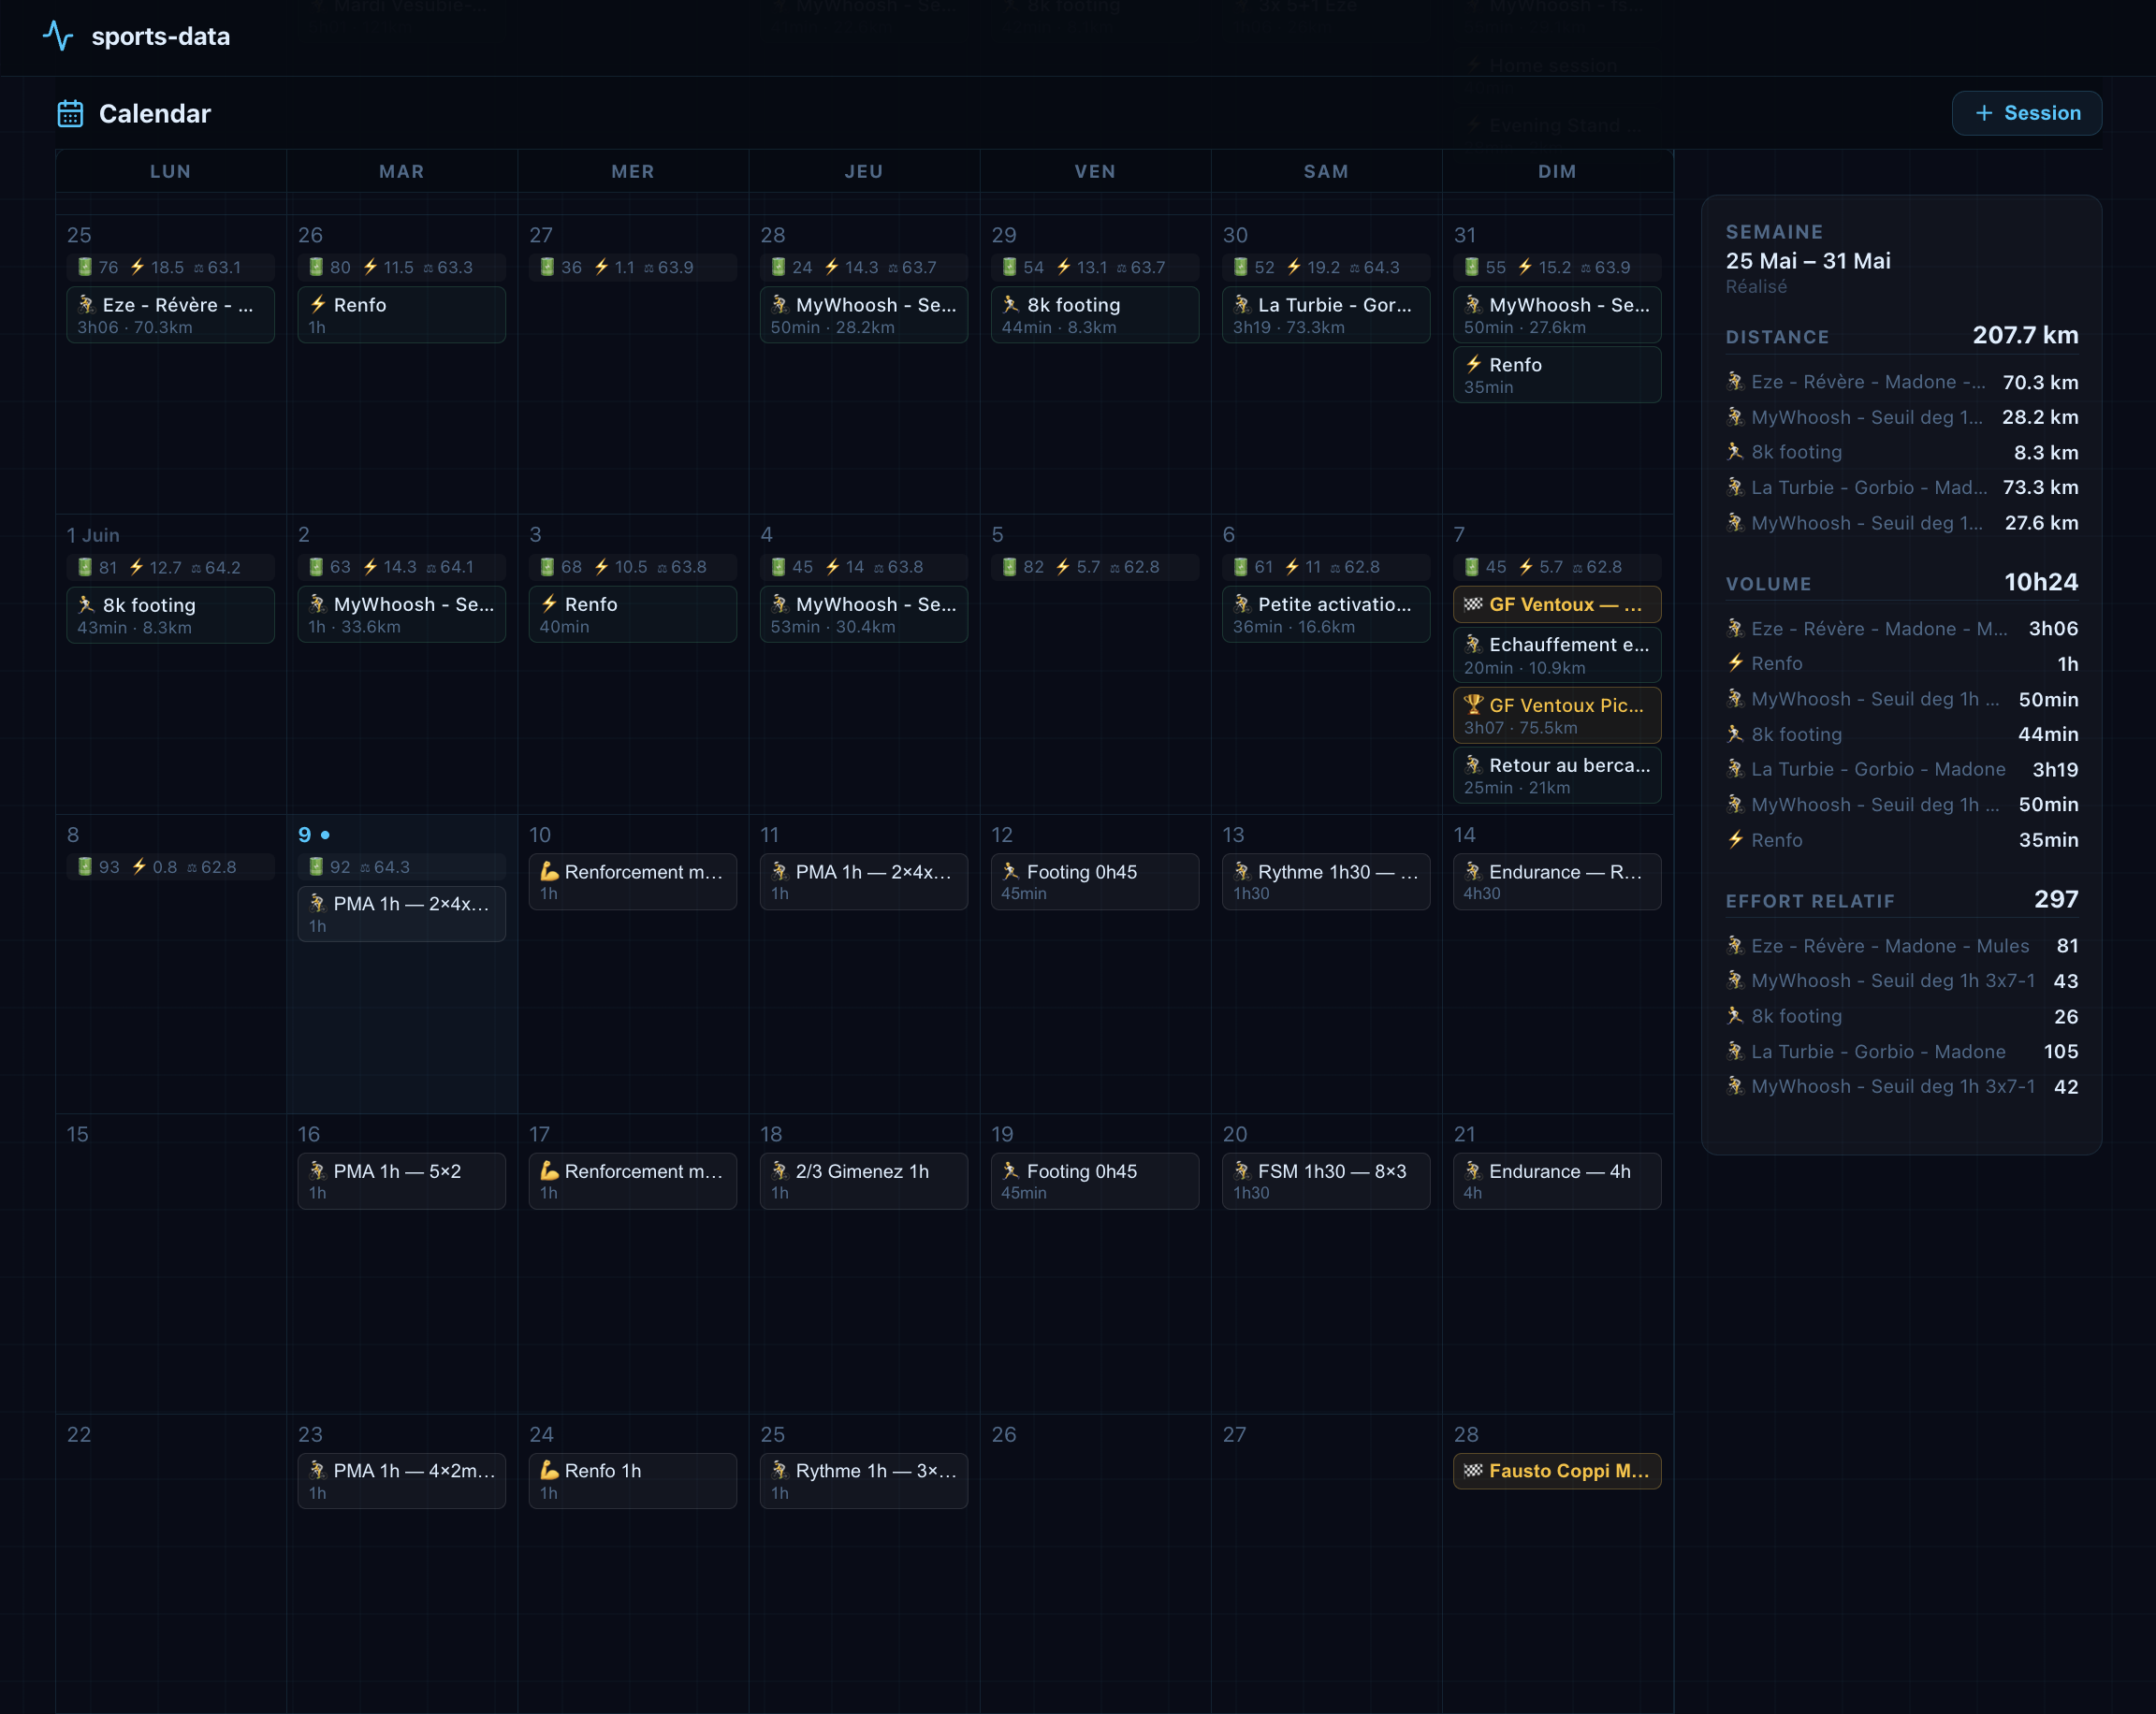
Calendar (in French) replaces TrainingPeaks. A monthly grid shows past and upcoming sessions colour-coded by type and intensity, with a weekly summary panel covering distance, duration, and training load. Completed sessions pull from Strava. Upcoming sessions come from a SQLite database on the VPS.
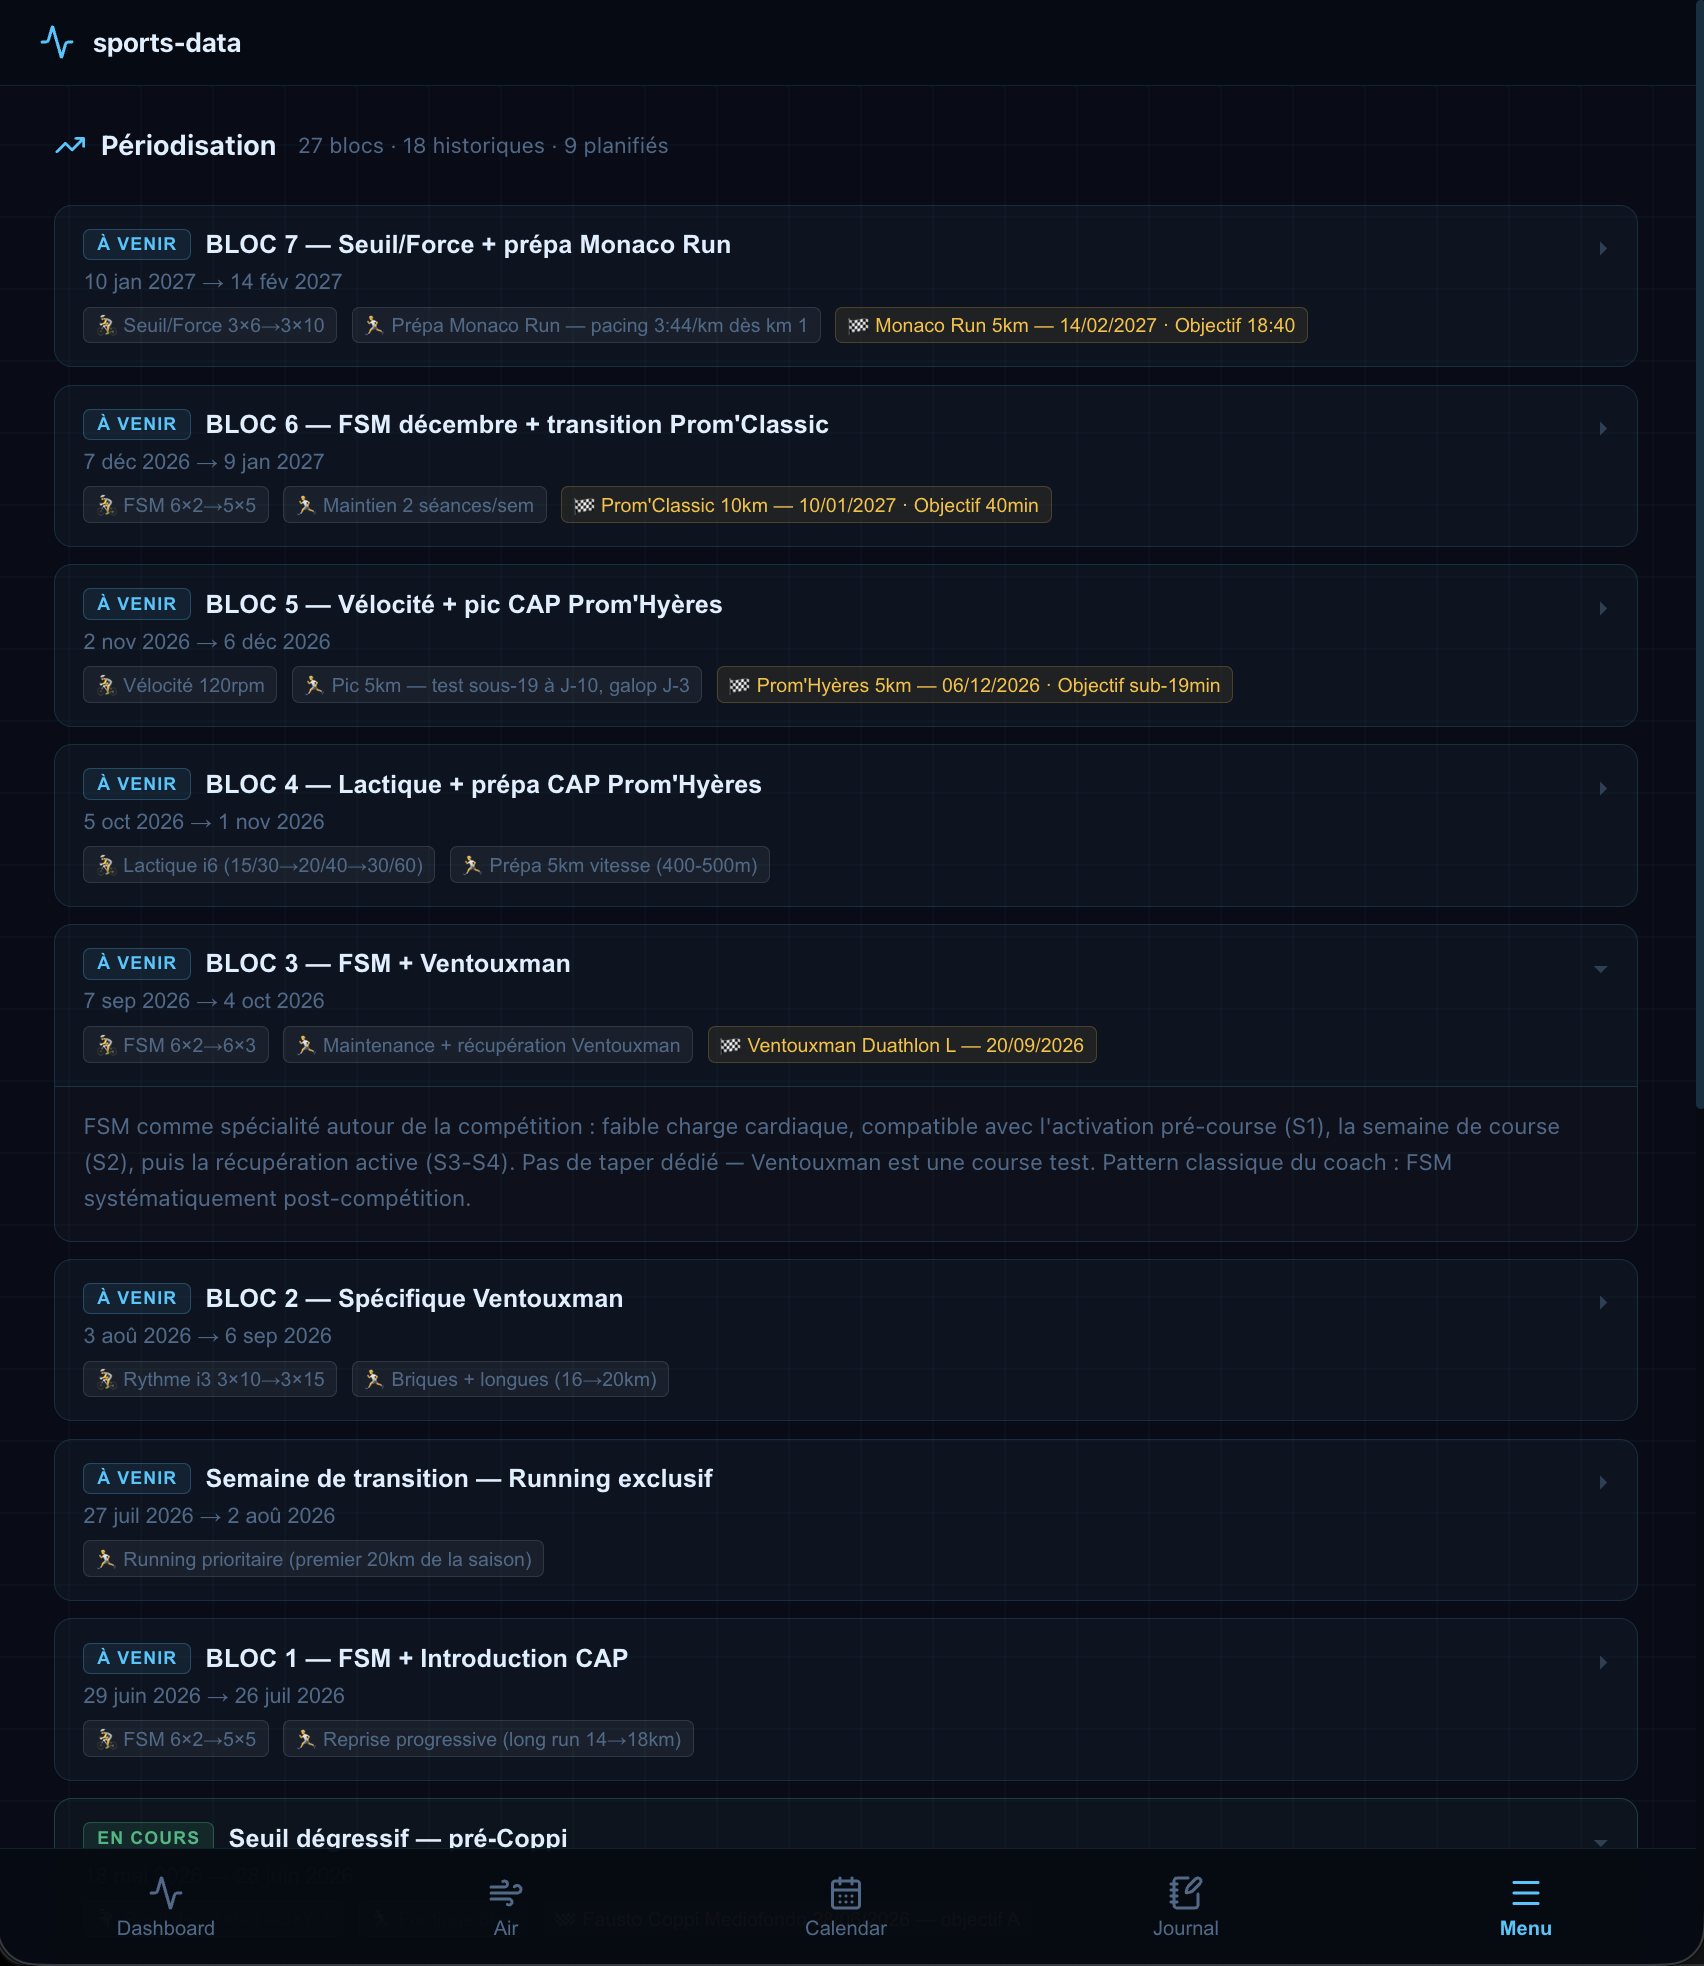
Periodisation (in French) makes the training plan legible. Each block appears in sequence from the current one through the full planning horizon, with its duration, its goal, and the reasoning behind it.
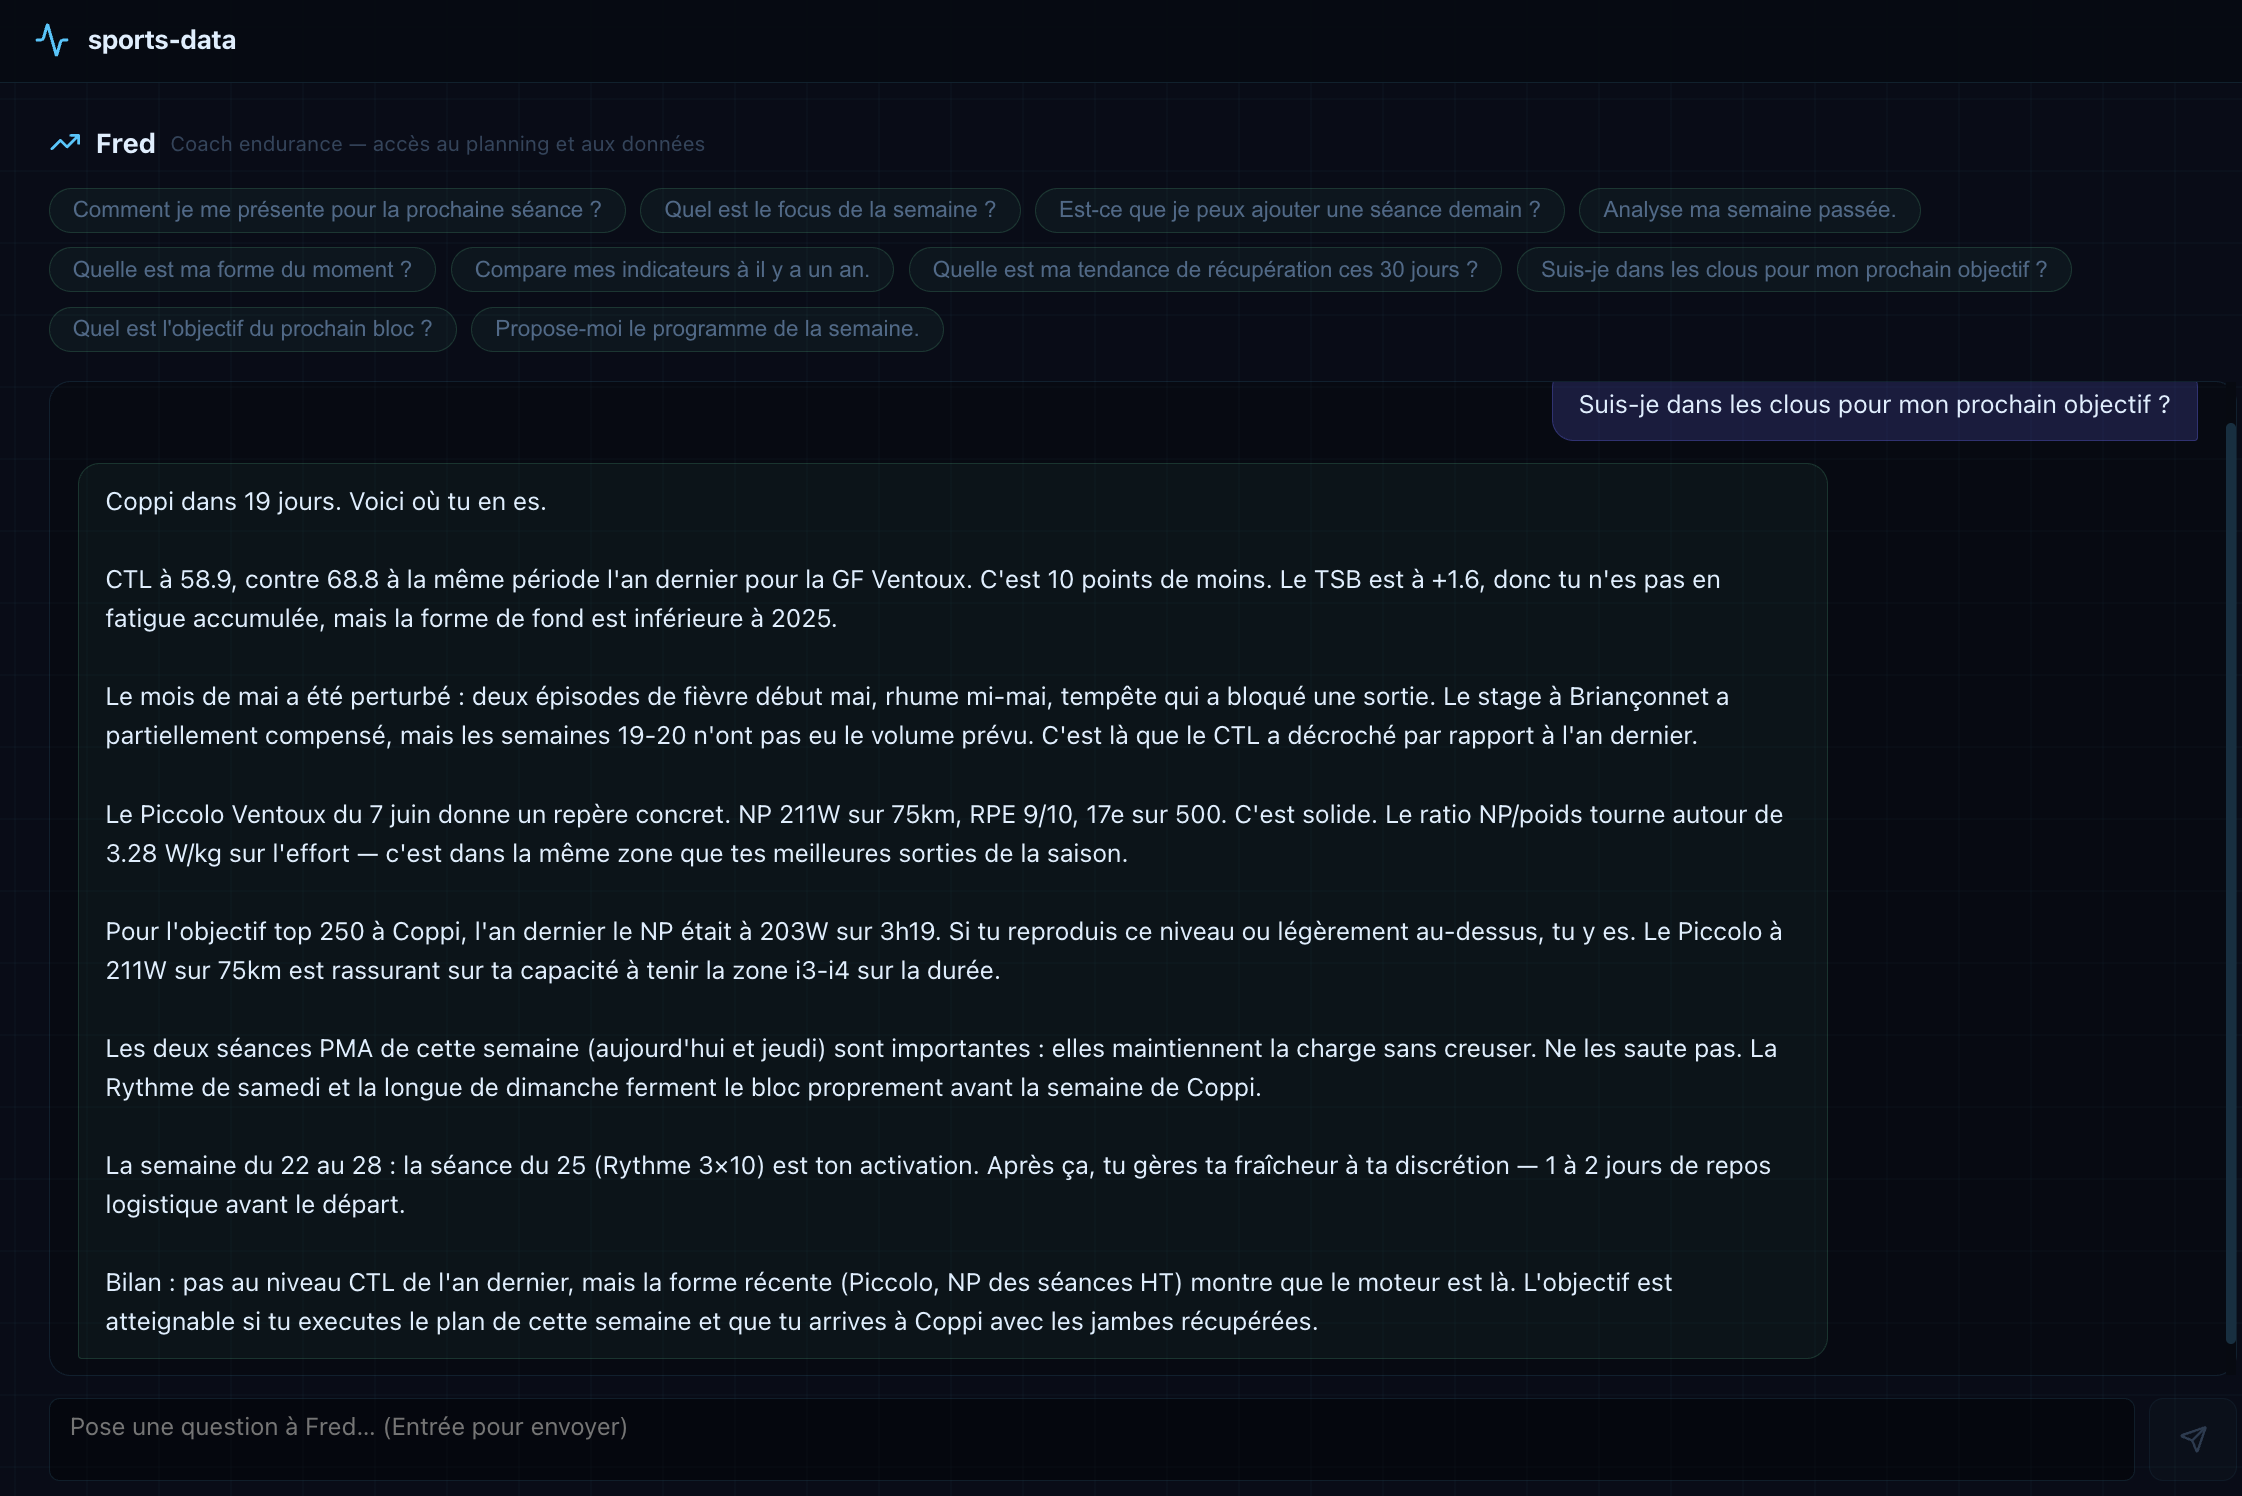
Fred (in French) is a direct chat with an AI coach running on Claude Sonnet. Quick prompts cover current form, readiness for the next objective, and the week’s programme. Each response draws on the full coaching knowledge base plus live data from all five sources.
The journal-to-report connection was the most useful addition. The Monday report references how I was actually feeling during the week, not just what the numbers say.
AtmoSud air quality data was the last source added, and the one that pushes the project beyond a purely sports app. Nice has measurable pollution events, particularly during Mediterranean wind inversions. Correlating outdoor air quality with recovery scores has turned out to be one of the more interesting signals in the dataset.
The next step is a CO2 sensor in the flat. Indoor CO2 accumulation affects sleep quality and recovery, both during the night and during indoor training sessions. Integrating that signal would close the loop between environment and performance in a way that no sports app currently offers.
Learnings
A full-stack app, FastAPI backend, React PWA, n8n orchestration, five data sources, was built in a few dozen hours. That speed is real. It is also the most misleading number to share, because what takes time is not the build. It is getting the system to hold.
The gap between working and stable is where the real effort lives. Before migrating to n8n, the pipeline went through five audit phases to verify observability at every step. Building fast is straightforward with modern AI tooling. Stabilising something you plan to run daily for two years is a different problem entirely.
Codex played a key role in that audit phase and in validating the migration to n8n for scalability. Using a model with a different reasoning approach, and a lower cost per token, proved relevant for a different kind of task: not building, but stress-testing. It caught edge cases and surfaced assumptions that had gone unquestioned. As with Euclid, not depending on a single model turned out to be a meaningful design choice, both for resilience and for the quality of the review.
Security is the first brake in production. Cloudflare Access, API keys in .env, rotating OAuth2 tokens: manageable in a private setup, significantly more complex to expose publicly. Whoop is the clearest example. OAuth2 with expiring refresh tokens, app credentials to manage, an undocumented flow. Getting that right took longer than most of the visible features.
Architecture decisions made early have a long tail. The choice to use a VPS as the single source of truth, with all data landing in CSV files server-side and never synced locally, was made deliberately. It avoided a divergence problem that would have been painful to fix later. The decision felt minor at the time.
Scope creep is natural and cumulative. Whoop and Strava first, then Intervals.icu, then Withings, then AtmoSud, then the PWA, then AI Chat. Each integration seemed contained. The combined maintenance surface is not. Every API has its own authentication pattern, rate limits, and failure modes. Understanding each one deeply is what makes the system maintainable.
The broader learning is not about security or architecture. It is about what AI tooling actually changes. LLMs lower the technical barrier to building. They do not lower the competence barrier to maintaining. You can build something complex and stable in days. Making it reliable over two years still requires understanding what you built, at every layer. That is an honest constraint, and one rarely stated in AI development write-ups.
Why it matters professionally
This project is a working proof-of-concept for patterns I reuse professionally: multi-source data pipelines with failure alerting, automated narrative reporting with LLMs, n8n orchestration, and lightweight internal tooling deployed on VPS infrastructure. The architecture is deliberately close to what a BI layer looks like in a B2B company: scheduled syncs, a single source of truth, a reporting layer on top. n8n runs self-hosted on the same VPS as the app itself, which means owning the full orchestration layer rather than delegating it to a managed platform.