Stack
About
Built into the sports-data app, this coaching system replaces a human coach with a structured knowledge layer drawn from years of documented training history. The system combines a static knowledge base covering coaching methodology, race calendar, athlete profile, and session library, with live performance data from Strava, WHOOP, and intervals.icu, and surfaces it through three tabs: a training calendar, a periodisation view, and a direct chat with Fred, an AI coach running on Claude Sonnet.
Each metric Fred reports is computed inside the app’s own tools, tuned to be fast and cheap in production. In parallel, I have been building a governed semantic layer over the same data, where each metric is defined once and an AI can only query the definitions that exist rather than recompute them its own way. It stays an experiment for now, deliberately downstream of the live system, but it points at where the definitions should eventually sit. I wrote up what that showed in one definition of a metric, even for the AI.
The story
After two years into a coaching relationship built around specific cycling objectives, the collaboration with my coach had run its course. The programming was good, the progression was real. But the cost had become significant and the rhythm had plateaued into a comfortable routine that was no longer pushing forward.
The question then was not whether to find another coach. It was whether the best parts of the training plan I followed in previous years could be preserved, and improved, by building something different. The structure of training blocks and weekly sessions was worth keeping. The time saved by not having to design the programme yourself was worth keeping. What a human coach could not provide was the ability to handle multiple data sources simultaneously and explain every programming decision in full, at any level of detail.
Building the knowledge base
Before a single line of code was written, the work was documentation. Over two years of training from my recent objectives were extracted and structured into a folder of Markdown files. The process was deliberate, taking several hours across multiple sessions, closer to a formal onboarding than a quick reference document. Previous experience as a competitive athlete and as a trainer made it possible to articulate what the methodology actually was, including the parts that had never been written down before.
coach/
├── context.md              # Training framework, data sources, historical performance, expectations
├── calendar.md             # Race calendar — A/B/C objective hierarchy across the season
├── persona.md              # Fred's identity, voice, knowledge scope, and explicit guardrails
├── athlete-profile.md      # Deep motivations, psychological profile, training preferences
├── questions.md            # Coach-athlete calibration questionnaire
├── workflow.md             # How plan updates flow between Fred, Claude Code, and the app
├── history/
│   ├── complete-blocks.md  # 19 training blocks (2 years) with session details and rationale
│   ├── session-library.md  # Full session library — intervals, zones, progressions
│   ├── cycling-sessions.md # ~250 cycling sessions with RPE and normalised power
│   └── running-prep.md     # Running preparation history
└── blocks/
    ├── periodisation.md    # Planned blocks with rationale — feeds the Periodisation tab in the app
    └── plan-h2-2026.md     # Detailed plan for H2 2026, session by session
Each file serves a distinct function. persona.md describes what Fred knows, and also specifies what he must not do, such as prescribing a taper like for pro athletes, fixating on a single daily recovery reading, suppressing training sessions without a solid reason. These are explicit guardrails written into the file. The restrictions matter as much as the knowledge. context.md holds the reasoning layer: coaching philosophy, training principles, the logic of each block type. The operational data (sessions, dates, power targets) lives separately in a SQLite database. The distinction is deliberate: structured data goes where it can be queried, natural language goes where it can be read, by a human or a model.
The folder has two levels of historical depth. history/ is backward-looking, the record of what was done and how it performed. blocks/ is forward-looking, the plan being built and the reasoning behind it. Keeping them separate makes it straightforward to update the plan without disturbing the reference material.
Writing these files changed more than the system. Going back over several years of blocks to understand the ordering and the progression patterns that had consistently worked: much of the logic that had been applied but never named became visible for the first time. The documentation was as much an audit of previous coaching relationships as a foundation for what came next.
How Fred works
Fred runs on Claude Sonnet, behind a single endpoint. Every question he receives is answered against a context assembled from four layers, plus five tools he can call himself when the answer needs an exact number.
The simplest way to picture it is a doctor who already knows your full history. Before the appointment they have read your file. When you walk in, you tell them how the past week went. If they need a specific measurement, they order a test. Fred works along the same lines, except the file, the conversation and the tests are really four layers with four different ways in. Two are always in front of him. Two are fetched only when they are needed.
Always present: the stable knowledge. The nine Markdown files in coach/ are loaded as a single cached block, around 31,600 tokens covering the coaching framework, the race calendar, the athlete profile, the periodisation logic, and the full training history. This block is served through the Anthropic prompt cache. On the first request of a session it is read in full. From the second request onward it is read from cache at a tenth of the price, $0.30 per million tokens instead of $3. The files are cached by modification time, so any change synced to the server is picked up on the next request with no restart. What Fred knows by heart updates itself the moment a file changes on disk.
Always present: the fresh snapshot. Rebuilt from scratch on every request, never cached, because it changes constantly. It has three parts. The short-term view holds current weight, the latest fitness load from intervals.icu, WHOOP recovery and HRV over 7 days, the last two weeks of Strava sessions with normalised power and perceived effort, the active and next training blocks, the six weeks of planned sessions ahead, and the five most recent journal notes. The comparative view holds four aggregate windows, the last 30 days, the same month a year ago, the current season and the previous season, each with around 26 values, which is what lets Fred compare one season against another. The daily view is a 30-day table written as compact CSV, one row per day, with recovery, HRV, resting heart rate, strain, sleep hours, sleep score, and cycling and running kilometres. This layer is roughly 9,900 tokens, and it carries what just happened.
Fetched on demand: the session library. One file is too large to keep in the permanent block, the session library, around 15,500 tokens of exact interval prescriptions and session variants. Rather than load it every time, Fred retrieves it by relevance. The library is split into around 48 self-contained chunks, each embedded with Voyage AI and stored in a small numpy index on the server. When a question looks like a lookup, the exact intervals of a named session for instance, the question is embedded, compared against every chunk by cosine similarity, and the top five above a threshold are injected into the runtime layer. If no chunk is relevant, nothing is added. The retrieval is best-effort, so if the index or the embedding key is missing, Fred answers without it rather than failing. This deliberately uses a plain numpy index rather than a heavyweight vector database, because the server is a small box and 48 chunks do not justify anything larger.
Fetched on demand: the tools. This pull layer is different in nature. The three layers above are text handed to Fred. The tools let Fred go and fetch exact figures himself, for anything beyond the 30-day daily window. When a question needs a precise number, Fred issues a tool call, the server runs it, the result comes back, and he continues, up to five turns inside a single answer. There are five tools:
- get_activity_detail returns the full breakdown of one session by date: normalised power, average and max power and heart rate, cadence, effort score, elevation, energy, and description.
- query_metric aggregates any of 20 metrics, from recovery, HRV and strain to sleep, body composition, normalised power, kilometres and training load, as a mean, max, min, sum or last value over any date range.
- list_sessions returns a filtered and sorted list of sessions over a range, by sport, by effort, by power or by load.
- get_activity_breakdown parses the segments, laps and splits already stored with each Strava activity: power, heart rate and ranking per segment, power and elevation per lap, pace and grade-adjusted pace per kilometre.
- get_best_efforts returns the mean-max curves from intervals.icu, the best sustained effort at 5 seconds, 1, 5, 20 and 60 minutes for power and heart rate, and the best 1k, 5k, 10k and half for pace, together with Functional Threshold Power, Critical Power and Maximal Aerobic Power, and the session that set each record. It can compare one season against another.
Both pull layers exist because they answer different questions. The session library is prose, and embeddings are good at prose: the shape of a session, the wording of a progression. They are poor at the magnitude of a number, at arithmetic, and at filtering by date. The tools cover exactly that gap. A question about how a session type is built is answered by retrieval. A question about the actual watts held last Tuesday is answered by a tool call. One reads the method, the other reads the record.
What this costs. The render order is tools, then the cached knowledge, then the conversation, so the cache marker sits on the static block and holds the tool definitions warm alongside it, around 32,000 tokens in total. A typical request costs about $0.048. A question that triggers a tool adds one to three cents, one that triggers retrieval adds a fraction of a cent. The full context, roughly 31,600 cached tokens plus 9,900 of live runtime, sits far below the 200,000-token capacity, so nothing competes for attention and nothing is truncated.
The three tabs
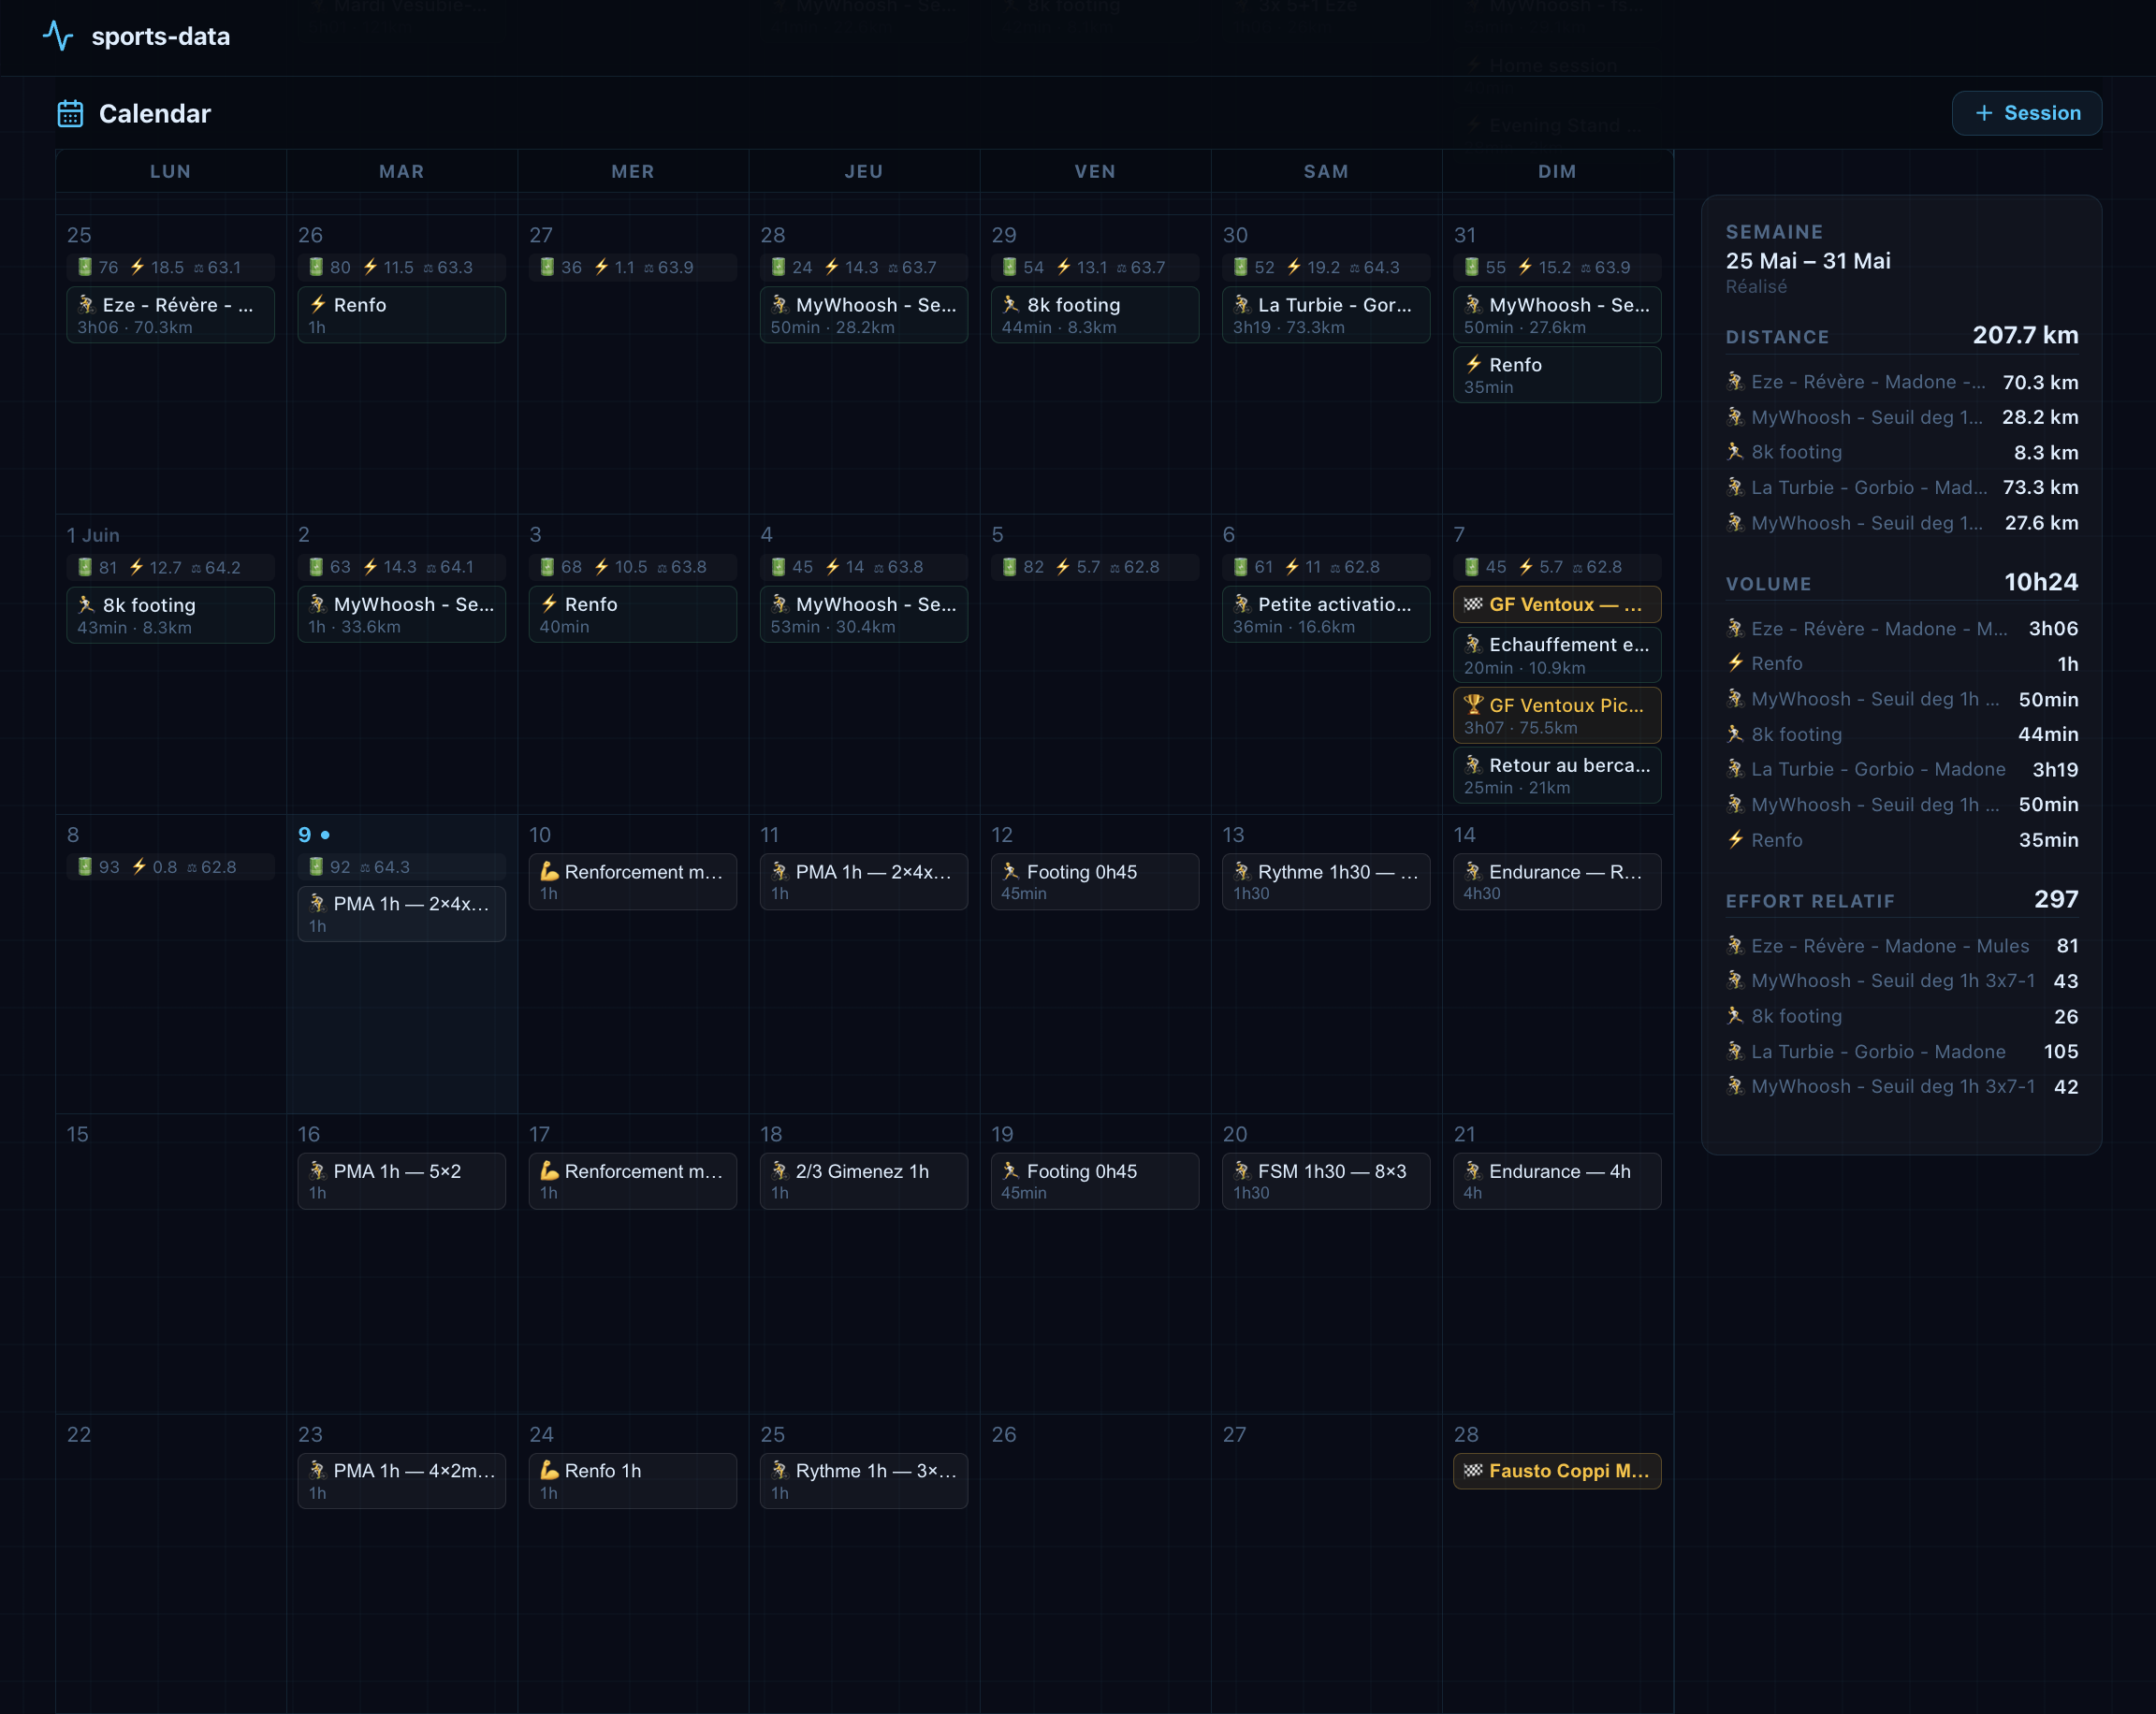
Calendar replaces TrainingPeaks. A monthly grid shows past and upcoming sessions, colour-coded by type and intensity, with a weekly summary panel on the right covering distance, duration, and training load. Completed sessions pull from Strava. Upcoming sessions come from the SQLite database on the VPS. Sessions can be moved or deleted directly in the app, and any changes are noted in the Journal so Fred sees them in context. The app does not duplicate session details: it redirects to Strava for anything deeper. The goal was to surface existing tools where they are relevant, not to replace them.
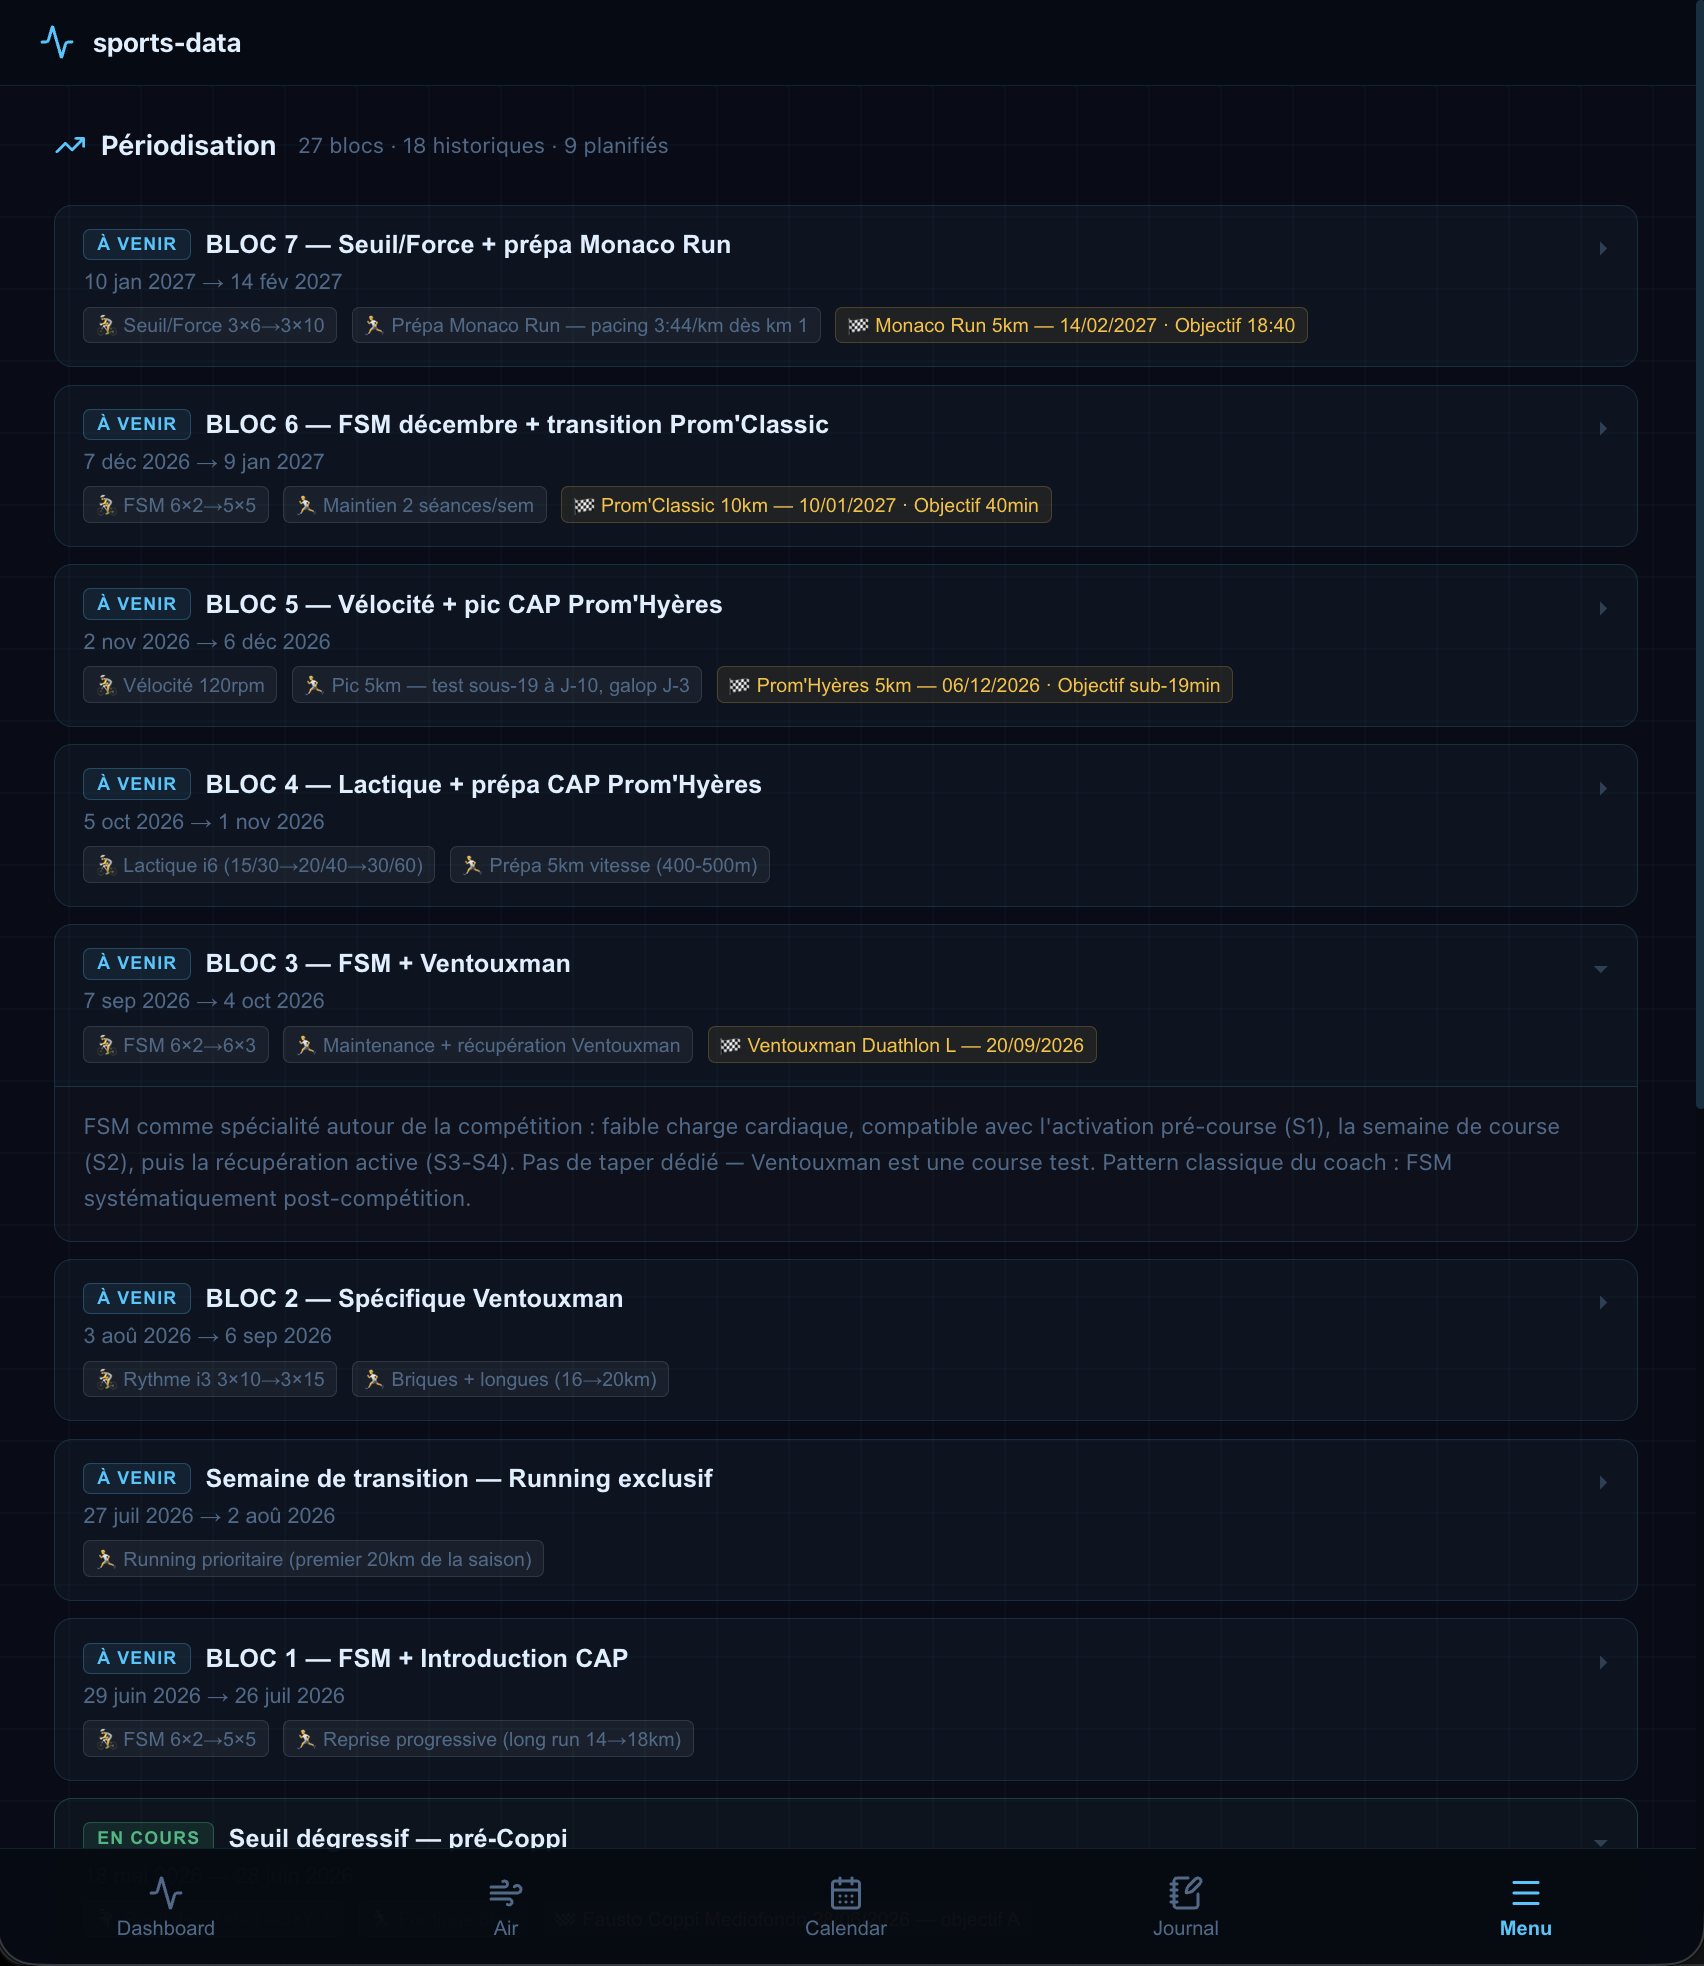
Periodisation makes the plan legible. Each training block appears in sequence from the current one through the full planning horizon, with its duration, its goal, and its sessions. The reasoning is written out: why this block now, why this sequence, what it builds toward. The full arc of a season is visible in one place for the first time.
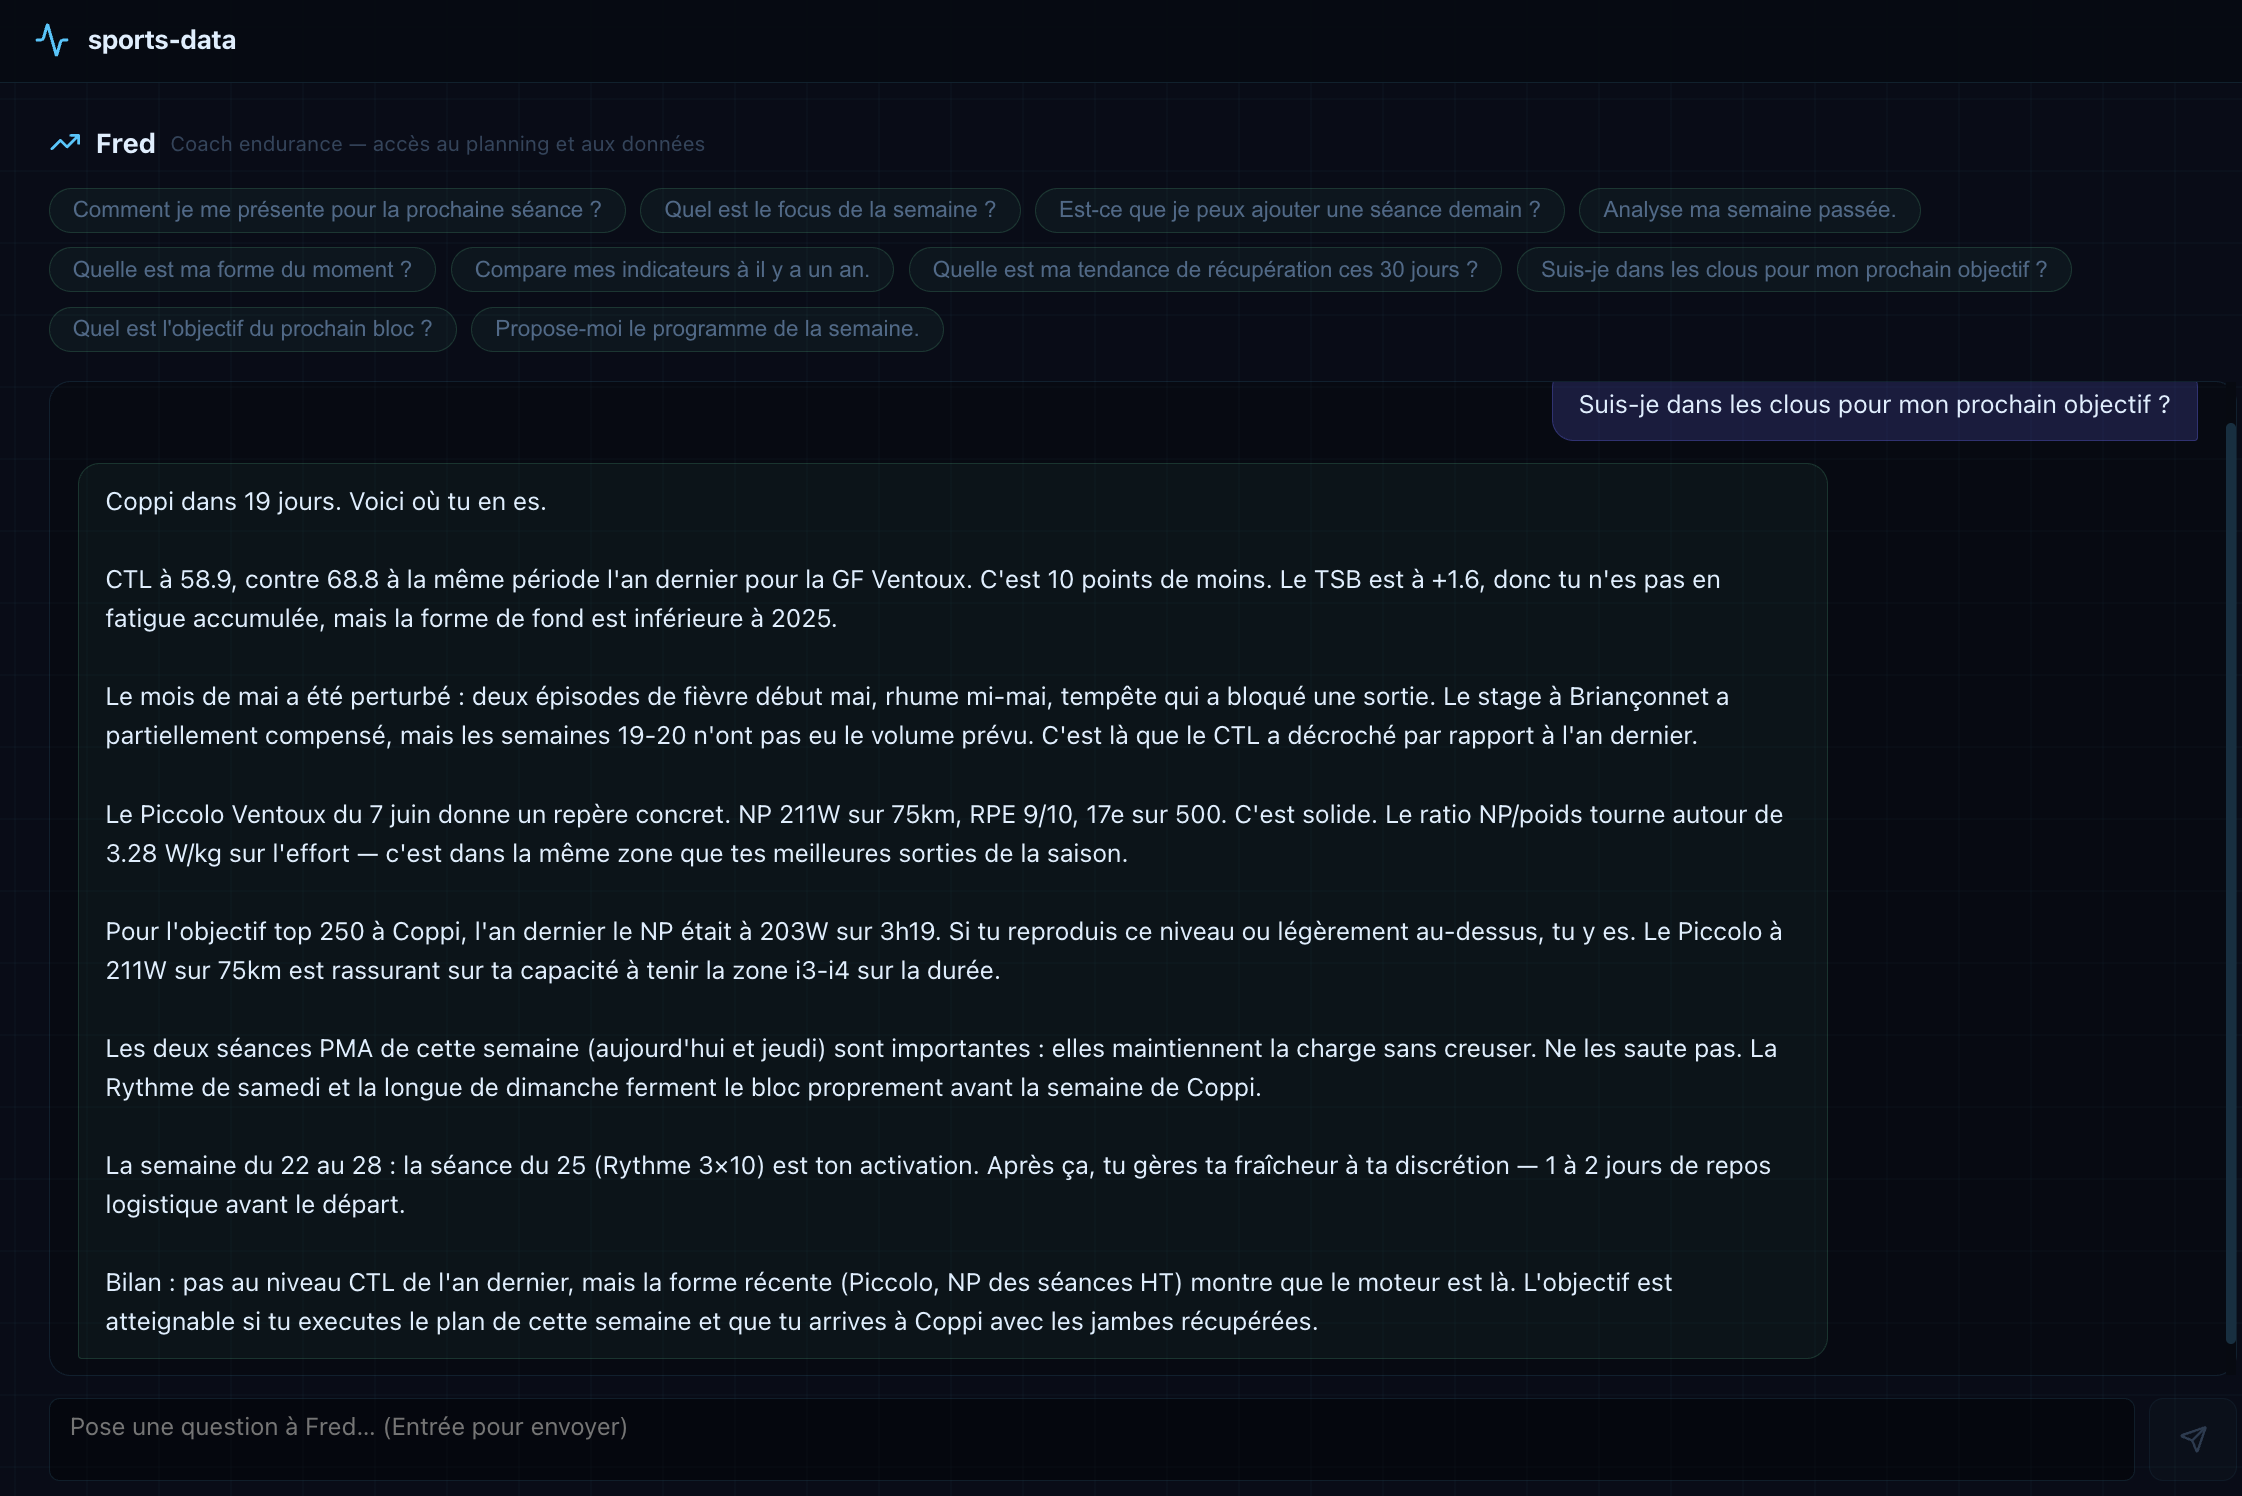
Fred is the tactical interface. Quick prompts cover the most common questions: current form, readiness for the next objective, the week’s programme, what the next block is building toward. Responses are grounded in the numbers. When the question is “am I on track for my next race?”, the answer references the fitness load delta versus the previous year, the current training stress balance, the power from recent sessions, and the sessions that remain before the event. For an exact figure, the watts held on a given climb or the best 20-minute power of the season, Fred calls a tool rather than estimating from memory. Fred can also explain every choice in full and at any level of detail, in a way the paid coaching relationship did not allow.
Consultative vs executive
Fred and Claude Code serve different functions.
Fred reads, reasons, and advises. He cannot modify the plan files, commit a change to Git, rebuild and deploy the app, or update his own system prompt. He is a counsellor without a pen.
Claude Code does all of that. It can rely on Fred to propose that a block should be adjusted, then turn that proposal into updated files, a redeployed app, and a committed change.
Fred now has the full methodology, the history, and the race calendar. Claude Code has write access. Keeping reasoning and execution in separate interfaces means no unreviewed change reaches the plan.
First test: GF Ventoux 2026
The first meaningful test of a race plan built entirely by the system was the GF Ventoux 2026 on 6 June, a 77km race with 2,100m of climbing. The same event had been run in 2025.
In 2026, the AI produced a section-by-section breakdown of the 2025 race, compared the fitness and freshness profiles across both seasons, and identified that despite 23% less training volume in the build, arriving fresh rather than fit was the right strategy. The plan was followed. The result was a 5% improvement in average power output and a 17th-place finish out of over 500 starters. For an athlete with several years of competitive experience at similar events, that margin is significant.
Honest limits
The system works because of what preceded it: years of competitive experience, a clean and consistent dataset, and prior coaching that established the methodology being documented. It is not a shortcut for someone starting from nothing. The preparation time is real, the domain expertise required is real, and the ongoing work of auditing outputs and updating files as the season evolves is what keeps it accurate over time.
Fred will also occasionally over-index on a single data point and needs to be redirected toward the broader trend. He can misread a vague date term as well, returning a correct number for the wrong period, which is why sensitive comparisons are worth pinning to explicit dates. Getting the guardrails right is an iterative process, not a one-time configuration.
The retrieval and tool layers are now live, and they draw the real map of what the system still cannot do. Air quality is available per period rather than day by day, since the daily table was compressed to save tokens. Fixed power per kilometre is not reachable at all, because Strava does not store it in its split data, so that figure only exists per lap or per segment. And the tools return simple aggregates rather than relational statistics, so Fred cannot correlate HRV against power on his own. These are deliberate trades, each one a known boundary rather than a gap left by accident. Beyond roughly three questions a minute the retrieval layer is throttled by the embedding provider’s free tier, and Fred answers without the library detail rather than stalling.
Why it matters professionally
The pattern this project demonstrates applies directly in a RevOps or Systems context: take a domain with accumulated expertise, structure that knowledge deliberately, connect live operational data to it, and build an interface designed around how it will actually be used.
The system only works because the subject matter was understood deeply first. That is also the most common failure mode in business: deploying an AI layer over generic or poorly structured knowledge produces generic outputs. Specific guardrails, coherent hierarchy across files, and continuous auditing of results are not AI problems. They are systems design problems. The project is never truly finished. It evolves as the season does.
The two-tier architecture, with Fred as a reasoning interface and Claude Code as an execution interface, has direct equivalents in a professional context: a sales intelligence layer that surfaces context versus a CRM that records actions, a reporting layer that explains versus a pipeline that transforms. Keeping those concerns separate is what makes each one maintainable.
The way Fred assembles context is a transferable pattern in its own right. Stable reference material stays in cache, cheap and always present. Fast-moving data is rebuilt fresh on every request. Anything too large or too precise to carry by default is fetched on demand, by relevance or by an explicit tool call. That is the same design a production assistant needs over a CRM or a data warehouse: keep the durable context cheap, and pull the live and exact figures only when a question asks for them. The split between what is always present and what is fetched on demand is not a coaching detail. It is how you keep a language model accurate and affordable against a large and constantly changing body of data.